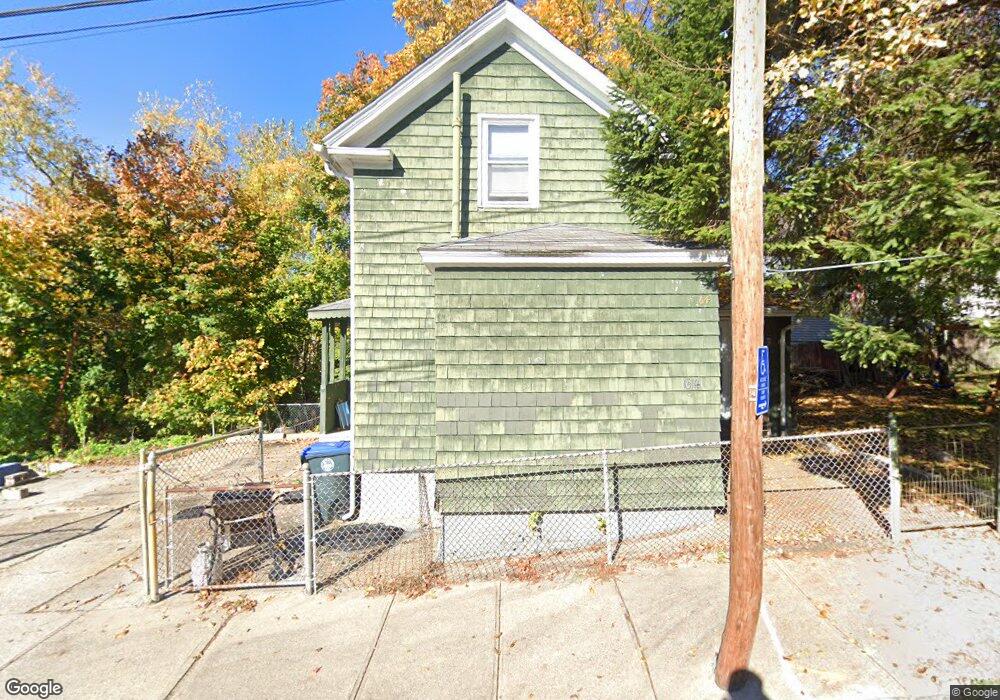
64 Paul St Providence, RI 02904
Charles NeighborhoodEstimated Value: $320,536 - $397,000
3
Beds
1
Bath
1,082
Sq Ft
$327/Sq Ft
Est. Value
About This Home
This home is located at 64 Paul St, Providence, RI 02904 and is currently estimated at $353,384, approximately $326 per square foot. 64 Paul St is a home located in Providence County with nearby schools including Times Squared Academy, Times2 Elementary School, and Times2 Middle/High School.
Ownership History
Date
Name
Owned For
Owner Type
Purchase Details
Closed on
May 28, 1997
Sold by
Brennan William F and Fetta Anna
Bought by
Brennan William A
Current Estimated Value
Home Financials for this Owner
Home Financials are based on the most recent Mortgage that was taken out on this home.
Original Mortgage
$65,280
Interest Rate
8.09%
Mortgage Type
VA
Create a Home Valuation Report for This Property
The Home Valuation Report is an in-depth analysis detailing your home's value as well as a comparison with similar homes in the area
Home Values in the Area
Average Home Value in this Area
Purchase History
| Date | Buyer | Sale Price | Title Company |
|---|---|---|---|
| Brennan William A | $64,000 | -- |
Source: Public Records
Mortgage History
| Date | Status | Borrower | Loan Amount |
|---|---|---|---|
| Open | Brennan William A | $83,469 | |
| Closed | Brennan William A | $103,000 | |
| Closed | Brennan William A | $40,000 | |
| Closed | Brennan William A | $65,280 |
Source: Public Records
Tax History
| Year | Tax Paid | Tax Assessment Tax Assessment Total Assessment is a certain percentage of the fair market value that is determined by local assessors to be the total taxable value of land and additions on the property. | Land | Improvement |
|---|---|---|---|---|
| 2025 | $2,220 | $264,300 | $126,700 | $137,600 |
| 2024 | $3,784 | $206,200 | $83,200 | $123,000 |
| 2023 | $3,784 | $206,200 | $83,200 | $123,000 |
| 2022 | $3,670 | $206,200 | $83,200 | $123,000 |
| 2021 | $3,431 | $139,700 | $60,300 | $79,400 |
| 2020 | $3,431 | $139,700 | $60,300 | $79,400 |
| 2019 | $3,431 | $139,700 | $60,300 | $79,400 |
| 2018 | $3,129 | $97,900 | $46,600 | $51,300 |
| 2017 | $3,129 | $97,900 | $46,600 | $51,300 |
| 2016 | $3,129 | $97,900 | $46,600 | $51,300 |
| 2015 | $3,191 | $96,400 | $47,200 | $49,200 |
| 2014 | $3,254 | $96,400 | $47,200 | $49,200 |
| 2013 | $3,254 | $96,400 | $47,200 | $49,200 |
Source: Public Records
Map
Nearby Homes
- 682 Charles St
- 666 Charles St
- 686 Charles St
- 115 Russo St Unit 115
- 115 Russo St Unit 2
- 115 Russo St
- 660 Charles St
- 681 Charles St
- 681 Charles St Unit 1
- 681 Charles St Unit 4
- 667 Charles St
- 111 Russo St
- 111 Russo St Unit 111
- 111 Russo St Unit 1
- 690 Charles St
- 685 Charles St
- 46 Paul St
- 107 Russo St
- 696 Charles St
- 663 Charles St
Your Personal Tour Guide
Ask me questions while you tour the home.