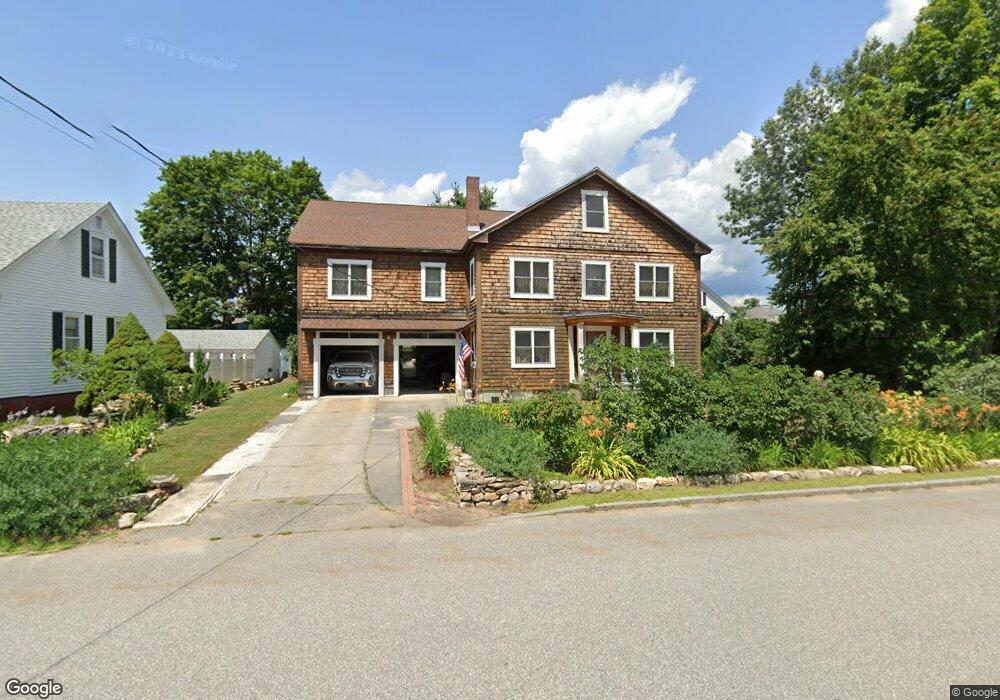
64 Pillsbury St Concord, NH 03301
South End NeighborhoodEstimated Value: $399,000 - $459,000
3
Beds
1
Bath
1,159
Sq Ft
$377/Sq Ft
Est. Value
About This Home
This home is located at 64 Pillsbury St, Concord, NH 03301 and is currently estimated at $436,829, approximately $376 per square foot. 64 Pillsbury St is a home located in Merrimack County with nearby schools including Abbot-Downing School, Rundlett Middle School, and Concord High School.
Ownership History
Date
Name
Owned For
Owner Type
Purchase Details
Closed on
Dec 8, 1997
Sold by
Stokes Est Virginia P
Bought by
Lessard Patrick A
Current Estimated Value
Home Financials for this Owner
Home Financials are based on the most recent Mortgage that was taken out on this home.
Original Mortgage
$76,050
Outstanding Balance
$12,923
Interest Rate
7.28%
Mortgage Type
Purchase Money Mortgage
Estimated Equity
$423,906
Create a Home Valuation Report for This Property
The Home Valuation Report is an in-depth analysis detailing your home's value as well as a comparison with similar homes in the area
Home Values in the Area
Average Home Value in this Area
Purchase History
| Date | Buyer | Sale Price | Title Company |
|---|---|---|---|
| Lessard Patrick A | $84,500 | -- |
Source: Public Records
Mortgage History
| Date | Status | Borrower | Loan Amount |
|---|---|---|---|
| Open | Lessard Patrick A | $76,050 |
Source: Public Records
Tax History Compared to Growth
Tax History
| Year | Tax Paid | Tax Assessment Tax Assessment Total Assessment is a certain percentage of the fair market value that is determined by local assessors to be the total taxable value of land and additions on the property. | Land | Improvement |
|---|---|---|---|---|
| 2024 | $9,309 | $336,200 | $105,500 | $230,700 |
| 2023 | $9,030 | $336,200 | $105,500 | $230,700 |
| 2022 | $8,704 | $336,200 | $105,500 | $230,700 |
| 2021 | $8,388 | $333,900 | $105,500 | $228,400 |
| 2020 | $8,413 | $314,400 | $88,200 | $226,200 |
| 2019 | $7,531 | $271,100 | $88,800 | $182,300 |
| 2018 | $7,033 | $249,500 | $88,800 | $160,700 |
| 2017 | $6,820 | $241,500 | $87,300 | $154,200 |
| 2016 | $6,403 | $231,400 | $87,300 | $144,100 |
| 2015 | $6,597 | $232,400 | $76,300 | $156,100 |
| 2014 | $6,231 | $232,400 | $76,300 | $156,100 |
| 2013 | -- | $230,800 | $76,300 | $154,500 |
| 2012 | -- | $234,700 | $76,300 | $158,400 |
Source: Public Records
Map
Nearby Homes
- 122 South St
- 33 Spruce St
- 105 S Main St
- 0 Spruce St Unit 88
- 0 South St Unit 4969509
- 24 Pierce St
- 5 Broad Ave
- 47 South St
- 10 Perley St
- 26 South St
- 4 Fayette St
- 24 Hazel Dr
- 22 Longmeadow Dr
- 2 Kensington Rd
- 1 Kensington Rd
- 53 Heather Ln
- 7 Highridge Trail
- 69 Manchester St Unit Lot 18
- 9 Strawberry Ln
- 11 Washington St