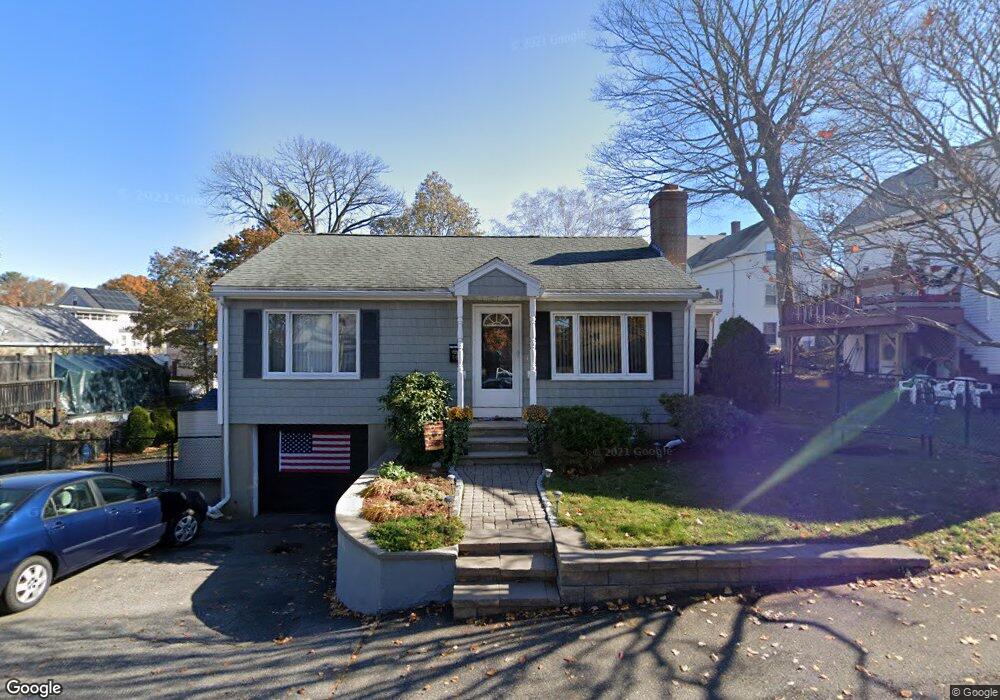
64 Pine St Stoneham, MA 02180
Haywardville NeighborhoodEstimated Value: $696,000 - $750,000
2
Beds
2
Baths
1,983
Sq Ft
$358/Sq Ft
Est. Value
About This Home
This home is located at 64 Pine St, Stoneham, MA 02180 and is currently estimated at $710,041, approximately $358 per square foot. 64 Pine St is a home located in Middlesex County with nearby schools including Stoneham High School, St. Patrick Elementary School, and Greater Boston Academy.
Ownership History
Date
Name
Owned For
Owner Type
Purchase Details
Closed on
Jun 27, 2013
Sold by
Saraceno Const Llc
Bought by
Lester Jill A and Lester Otis J
Current Estimated Value
Home Financials for this Owner
Home Financials are based on the most recent Mortgage that was taken out on this home.
Original Mortgage
$339,000
Outstanding Balance
$242,175
Interest Rate
3.51%
Mortgage Type
New Conventional
Estimated Equity
$467,866
Purchase Details
Closed on
Dec 28, 2012
Sold by
Us Bank Na
Bought by
Saraceno Const Llc
Purchase Details
Closed on
Aug 29, 2003
Sold by
Patterson Pamela A
Bought by
Patterson Pamela A and Patterson Mark P
Purchase Details
Closed on
Apr 29, 1994
Sold by
Celona Rudolph S and Celona Maria
Bought by
Darragh Pamela A
Create a Home Valuation Report for This Property
The Home Valuation Report is an in-depth analysis detailing your home's value as well as a comparison with similar homes in the area
Home Values in the Area
Average Home Value in this Area
Purchase History
| Date | Buyer | Sale Price | Title Company |
|---|---|---|---|
| Lester Jill A | $367,000 | -- | |
| Lester Jill A | $367,000 | -- | |
| Saraceno Const Llc | $192,500 | -- | |
| Patterson Pamela A | -- | -- | |
| Darragh Pamela A | $139,900 | -- | |
| Darragh Pamela A | $139,900 | -- |
Source: Public Records
Mortgage History
| Date | Status | Borrower | Loan Amount |
|---|---|---|---|
| Open | Lester Jill A | $339,000 | |
| Closed | Lester Jill A | $339,000 | |
| Previous Owner | Darragh Pamela A | $98,000 | |
| Previous Owner | Darragh Pamela A | $175,000 |
Source: Public Records
Tax History
| Year | Tax Paid | Tax Assessment Tax Assessment Total Assessment is a certain percentage of the fair market value that is determined by local assessors to be the total taxable value of land and additions on the property. | Land | Improvement |
|---|---|---|---|---|
| 2025 | $5,897 | $576,400 | $330,900 | $245,500 |
| 2024 | $5,700 | $538,200 | $304,800 | $233,400 |
| 2023 | $5,581 | $502,800 | $278,700 | $224,100 |
| 2022 | $4,844 | $465,300 | $252,500 | $212,800 |
| 2021 | $4,739 | $438,000 | $235,100 | $202,900 |
| 2020 | $4,589 | $425,300 | $219,700 | $205,600 |
| 2019 | $4,651 | $414,500 | $215,200 | $199,300 |
| 2018 | $4,417 | $377,200 | $185,900 | $191,300 |
| 2017 | $4,327 | $349,200 | $166,600 | $182,600 |
| 2016 | $3,961 | $311,900 | $166,600 | $145,300 |
| 2015 | $3,683 | $284,200 | $150,700 | $133,500 |
| 2014 | $3,607 | $267,400 | $126,900 | $140,500 |
Source: Public Records
Map
Nearby Homes
- 8 Common St Unit 3
- 137 Franklin St Unit 102
- 10 Pomeworth St Unit A
- 57 Park St
- 6 Everett St
- 5 Chapel Way
- 17 Franklin St
- 7 Carol St
- 51 Spring St
- 159 Franklin St Unit D2
- 159 Franklin St Unit C2
- 159 Franklin St Unit E6
- 4 Garfield Ave
- 21 Tremont St Unit B
- 21 Tremont St Unit A
- 35 Tremont St
- 1 Tremont St
- 58 Washington St
- 200 Ledgewood Dr Unit 601
- 33 Lake Ave
Your Personal Tour Guide
Ask me questions while you tour the home.