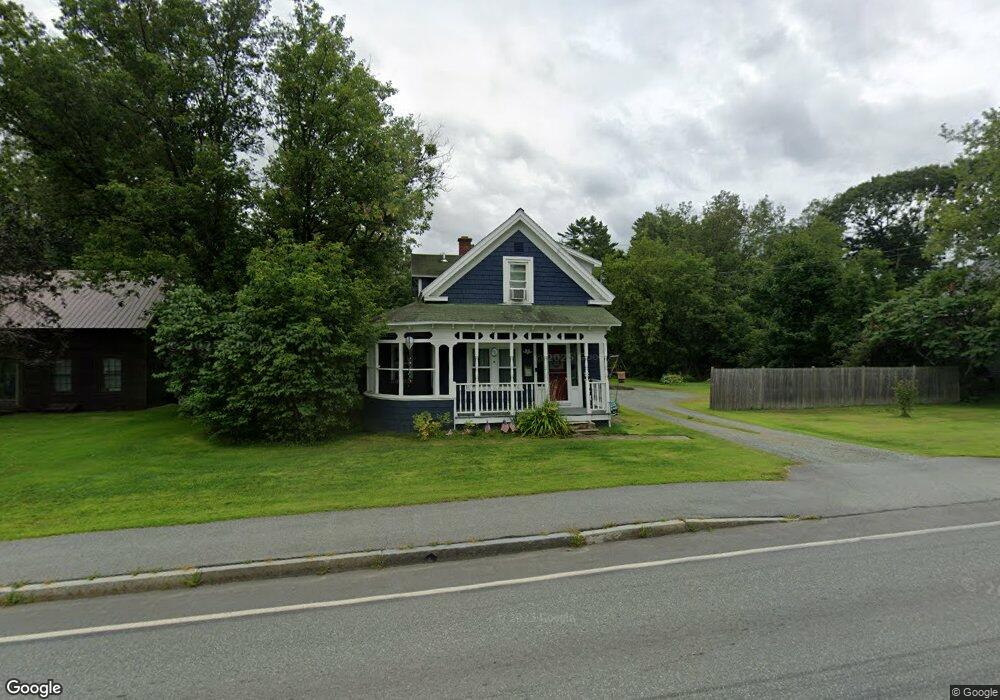
64 Prospect St Lancaster, NH 03584
Estimated Value: $280,000 - $390,000
3
Beds
2
Baths
2,615
Sq Ft
$123/Sq Ft
Est. Value
About This Home
This home is located at 64 Prospect St, Lancaster, NH 03584 and is currently estimated at $322,149, approximately $123 per square foot. 64 Prospect St is a home located in Coos County with nearby schools including Lancaster Elementary School, White Mountains Regional High School, and North Country Charter Academy Lancaster (M).
Ownership History
Date
Name
Owned For
Owner Type
Purchase Details
Closed on
Sep 24, 2021
Sold by
Sabourin Dennis S and Sabourin Kellie A
Bought by
Sabourin Kellie A
Current Estimated Value
Home Financials for this Owner
Home Financials are based on the most recent Mortgage that was taken out on this home.
Original Mortgage
$140,000
Outstanding Balance
$126,274
Interest Rate
2.8%
Mortgage Type
Stand Alone Refi Refinance Of Original Loan
Estimated Equity
$195,875
Purchase Details
Closed on
Aug 18, 1999
Sold by
Botting William A and Botting Catherine P
Bought by
Sabourin Dennis S
Home Financials for this Owner
Home Financials are based on the most recent Mortgage that was taken out on this home.
Original Mortgage
$66,452
Interest Rate
7.6%
Create a Home Valuation Report for This Property
The Home Valuation Report is an in-depth analysis detailing your home's value as well as a comparison with similar homes in the area
Home Values in the Area
Average Home Value in this Area
Purchase History
| Date | Buyer | Sale Price | Title Company |
|---|---|---|---|
| Sabourin Kellie A | -- | None Available | |
| Sabourin Kellie A | -- | None Available | |
| Sabourin Dennis S | $67,000 | -- | |
| Sabourin Dennis S | $67,000 | -- |
Source: Public Records
Mortgage History
| Date | Status | Borrower | Loan Amount |
|---|---|---|---|
| Open | Sabourin Kellie A | $140,000 | |
| Previous Owner | Sabourin Dennis S | $47,510 | |
| Previous Owner | Sabourin Dennis S | $122,800 | |
| Previous Owner | Sabourin Dennis S | $66,452 |
Source: Public Records
Tax History
| Year | Tax Paid | Tax Assessment Tax Assessment Total Assessment is a certain percentage of the fair market value that is determined by local assessors to be the total taxable value of land and additions on the property. | Land | Improvement |
|---|---|---|---|---|
| 2025 | $4,538 | $215,400 | $38,300 | $177,100 |
| 2024 | $4,131 | $215,400 | $38,300 | $177,100 |
| 2023 | $3,729 | $215,400 | $38,300 | $177,100 |
| 2022 | $3,257 | $134,100 | $23,100 | $111,000 |
| 2021 | $3,512 | $134,100 | $23,100 | $111,000 |
| 2020 | $3,318 | $134,100 | $23,100 | $111,000 |
| 2019 | $3,339 | $134,100 | $23,100 | $111,000 |
| 2018 | $3,446 | $134,100 | $23,100 | $111,000 |
| 2017 | $3,185 | $129,100 | $22,400 | $106,700 |
| 2016 | $3,306 | $129,100 | $22,400 | $106,700 |
| 2015 | $3,549 | $129,100 | $22,400 | $106,700 |
| 2014 | $3,021 | $129,100 | $22,400 | $106,700 |
| 2013 | $3,014 | $129,100 | $22,400 | $106,700 |
Source: Public Records
Map
Nearby Homes
- 44 Prospect St
- 000 Spring St
- 39 Elm St
- 19 Elm St
- Lot 26 Hartco Ave
- Lot 21 Hartco Ave
- Lot 11 Hartco Ave
- Lot 14 Hartco Ave
- Lot 9 Hartco Ave
- Lot 24 Hartco Ave
- Lot 23 Hartco Ave
- Lot 17 Hartco Ave
- Lot 20 Hartco Ave
- Lot 13 Hartco Ave
- Lot 15 Hartco Ave
- Lot 19 Hartco Ave
- Lot 33-34 Hartco Ave
- Lot 13A Hartco Ave
- Lot 18 Hartco Ave
- Lot 25 Hartco Ave
Your Personal Tour Guide
Ask me questions while you tour the home.