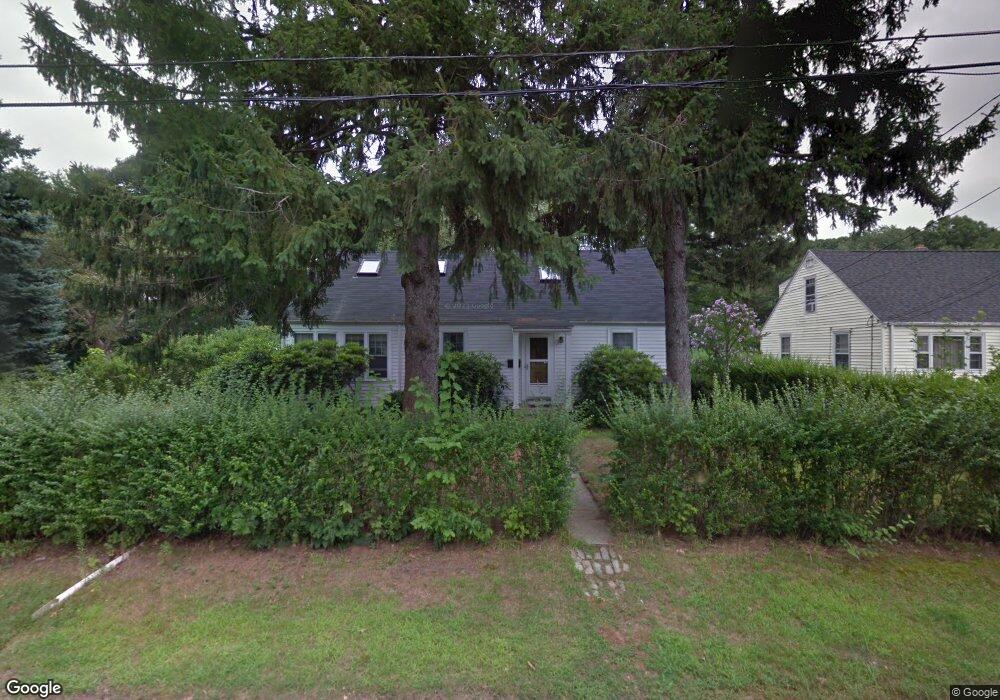
64 Shirley St Warwick, RI 02888
Spring Green NeighborhoodEstimated Value: $373,531 - $439,000
3
Beds
1
Bath
1,386
Sq Ft
$300/Sq Ft
Est. Value
About This Home
This home is located at 64 Shirley St, Warwick, RI 02888 and is currently estimated at $415,133, approximately $299 per square foot. 64 Shirley St is a home located in Kent County with nearby schools including St. Peter School and Saint Paul School.
Ownership History
Date
Name
Owned For
Owner Type
Purchase Details
Closed on
Dec 21, 2006
Sold by
Clarke David A
Bought by
Alegmas Alfred
Current Estimated Value
Home Financials for this Owner
Home Financials are based on the most recent Mortgage that was taken out on this home.
Original Mortgage
$231,750
Interest Rate
6.35%
Mortgage Type
Purchase Money Mortgage
Create a Home Valuation Report for This Property
The Home Valuation Report is an in-depth analysis detailing your home's value as well as a comparison with similar homes in the area
Home Values in the Area
Average Home Value in this Area
Purchase History
| Date | Buyer | Sale Price | Title Company |
|---|---|---|---|
| Alegmas Alfred | $257,500 | -- |
Source: Public Records
Mortgage History
| Date | Status | Borrower | Loan Amount |
|---|---|---|---|
| Open | Alegmas Alfred | $211,600 | |
| Closed | Alegmas Alfred | $231,750 | |
| Previous Owner | Alegmas Alfred | $200,000 |
Source: Public Records
Tax History Compared to Growth
Tax History
| Year | Tax Paid | Tax Assessment Tax Assessment Total Assessment is a certain percentage of the fair market value that is determined by local assessors to be the total taxable value of land and additions on the property. | Land | Improvement |
|---|---|---|---|---|
| 2025 | $4,059 | $319,600 | $106,400 | $213,200 |
| 2024 | $3,800 | $262,600 | $87,900 | $174,700 |
| 2023 | $3,726 | $262,600 | $87,900 | $174,700 |
| 2022 | $3,538 | $188,900 | $55,500 | $133,400 |
| 2021 | $3,538 | $188,900 | $55,500 | $133,400 |
| 2020 | $3,538 | $188,900 | $55,500 | $133,400 |
| 2019 | $3,538 | $188,900 | $55,500 | $133,400 |
| 2018 | $3,401 | $163,500 | $55,500 | $108,000 |
| 2017 | $3,309 | $163,500 | $55,500 | $108,000 |
| 2016 | $3,309 | $163,500 | $55,500 | $108,000 |
| 2015 | $3,413 | $164,500 | $63,000 | $101,500 |
| 2014 | $3,300 | $164,500 | $63,000 | $101,500 |
| 2013 | $3,255 | $164,500 | $63,000 | $101,500 |
Source: Public Records
Map
Nearby Homes
- 208 Negansett Ave
- 845 Warwick Ave
- 259 Holmes Rd
- 158 Underwood Ave
- 63 Benbridge Ave
- 126 Fairfax Dr
- 341 Sumner Ave
- 196 Harrison Ave
- 170 Holmes Rd
- 56 Errol St
- 1052 Post Rd
- 94 Holmes Rd
- 8 Byron Blvd
- 110 Heath Ave
- 92 Washington St
- 0 Holmes Rd
- 110 Pilgrim Pkwy Unit 8
- 345 Post Rd
- 95 Roosevelt St
- 447 Harrington Ave