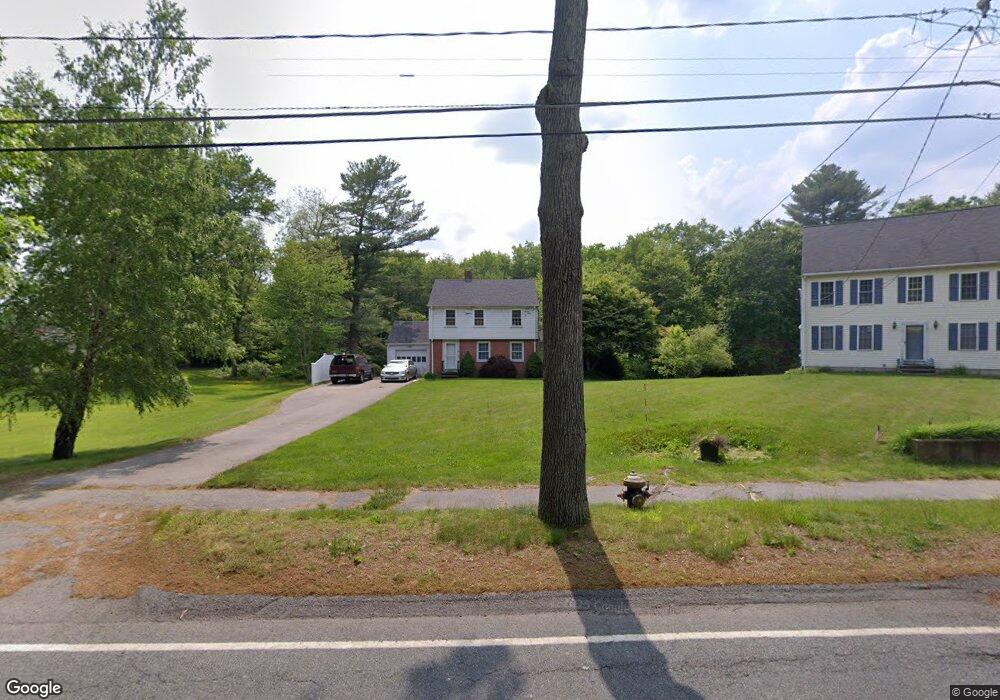
64 Spring St West Bridgewater, MA 02379
Estimated Value: $539,000 - $636,019
3
Beds
1
Bath
1,414
Sq Ft
$414/Sq Ft
Est. Value
About This Home
This home is located at 64 Spring St, West Bridgewater, MA 02379 and is currently estimated at $585,005, approximately $413 per square foot. 64 Spring St is a home located in Plymouth County with nearby schools including Spring Street Elementary School, Howard Elementary School, and Rose L. MacDonald Elementary School.
Ownership History
Date
Name
Owned For
Owner Type
Purchase Details
Closed on
Oct 24, 2024
Sold by
Jones Laurel A and Jones Heather J
Bought by
Jones Matthew S
Current Estimated Value
Purchase Details
Closed on
Jun 11, 2024
Sold by
Alden Miller Jones T and Alden Jones
Bought by
Jones Matthew S
Purchase Details
Closed on
Dec 27, 1999
Sold by
Pheasant Rt and Estabrooks Everett L
Bought by
Miller Betty A
Create a Home Valuation Report for This Property
The Home Valuation Report is an in-depth analysis detailing your home's value as well as a comparison with similar homes in the area
Home Values in the Area
Average Home Value in this Area
Purchase History
| Date | Buyer | Sale Price | Title Company |
|---|---|---|---|
| Jones Matthew S | -- | None Available | |
| Jones Matthew S | -- | None Available | |
| Jones Matthew S | -- | None Available | |
| Jones Matthew S | -- | None Available | |
| Miller Betty A | $150,000 | -- | |
| Miller Betty A | $150,000 | -- |
Source: Public Records
Tax History Compared to Growth
Tax History
| Year | Tax Paid | Tax Assessment Tax Assessment Total Assessment is a certain percentage of the fair market value that is determined by local assessors to be the total taxable value of land and additions on the property. | Land | Improvement |
|---|---|---|---|---|
| 2025 | $7,499 | $548,600 | $330,800 | $217,800 |
| 2024 | $7,414 | $523,200 | $309,100 | $214,100 |
| 2023 | $6,884 | $447,900 | $264,500 | $183,400 |
| 2022 | $6,605 | $407,200 | $253,600 | $153,600 |
| 2021 | $6,572 | $393,300 | $253,600 | $139,700 |
| 2020 | $0 | $393,300 | $253,600 | $139,700 |
| 2019 | $0 | $387,800 | $253,600 | $134,200 |
| 2018 | $6,413 | $375,000 | $244,900 | $130,100 |
| 2017 | $0 | $356,100 | $229,600 | $126,500 |
| 2016 | $6,221 | $345,600 | $219,100 | $126,500 |
| 2015 | $6,075 | $341,100 | $219,100 | $122,000 |
| 2014 | $5,600 | $339,600 | $219,100 | $120,500 |
Source: Public Records
Map
Nearby Homes
- 122 N Elm St
- 29 Ellis Ave
- 10 Charles St
- Lot 1 Jeffrey Ln
- 6 Maddison
- 92 Bryant St
- 281 Spring St
- 42 Matfield St
- 260 Crescent St
- 192 S Main St
- 282 Crescent St
- 279 Crescent St
- 227 S Elm Lot2
- 34 Captain Carlson Way
- 323 S Elm St
- 21 Roosevelt Ave
- 19 Progressive Ave
- 18 American Ave
- 30 Keenan St
- 6 Andrea Way