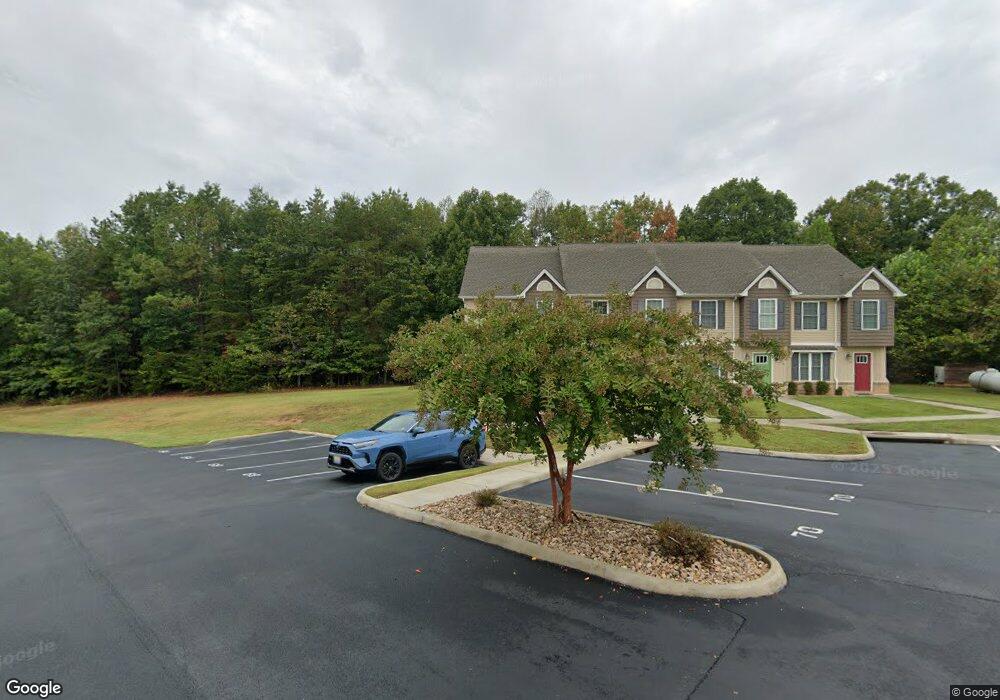
64 Squire Cir Lynchburg, VA 24501
Estimated Value: $243,000 - $257,000
3
Beds
3
Baths
1,312
Sq Ft
$190/Sq Ft
Est. Value
About This Home
This home is located at 64 Squire Cir, Lynchburg, VA 24501 and is currently estimated at $249,712, approximately $190 per square foot. 64 Squire Cir is a home located in Campbell County with nearby schools including Yellow Branch Elementary School, Rustburg Middle School, and Rustburg High School.
Ownership History
Date
Name
Owned For
Owner Type
Purchase Details
Closed on
Jun 2, 2017
Sold by
Krb Properties Llc A Virginia Limited Li
Bought by
Ojili Venkata Satish and Ojili Srujana
Current Estimated Value
Home Financials for this Owner
Home Financials are based on the most recent Mortgage that was taken out on this home.
Original Mortgage
$119,900
Outstanding Balance
$99,595
Interest Rate
3.97%
Mortgage Type
New Conventional
Estimated Equity
$150,117
Create a Home Valuation Report for This Property
The Home Valuation Report is an in-depth analysis detailing your home's value as well as a comparison with similar homes in the area
Home Values in the Area
Average Home Value in this Area
Purchase History
| Date | Buyer | Sale Price | Title Company |
|---|---|---|---|
| Ojili Venkata Satish | $159,900 | Attorney |
Source: Public Records
Mortgage History
| Date | Status | Borrower | Loan Amount |
|---|---|---|---|
| Open | Ojili Venkata Satish | $119,900 |
Source: Public Records
Tax History Compared to Growth
Tax History
| Year | Tax Paid | Tax Assessment Tax Assessment Total Assessment is a certain percentage of the fair market value that is determined by local assessors to be the total taxable value of land and additions on the property. | Land | Improvement |
|---|---|---|---|---|
| 2025 | $783 | $174,100 | $20,000 | $154,100 |
| 2024 | $783 | $174,100 | $20,000 | $154,100 |
| 2023 | $783 | $174,100 | $20,000 | $154,100 |
| 2022 | $778 | $149,700 | $20,000 | $129,700 |
| 2021 | $778 | $149,700 | $20,000 | $129,700 |
| 2020 | $778 | $143,800 | $20,000 | $123,800 |
| 2019 | $778 | $149,700 | $20,000 | $129,700 |
| 2018 | $748 | $143,800 | $20,000 | $123,800 |
| 2017 | $748 | $143,800 | $20,000 | $123,800 |
| 2016 | $104 | $20,000 | $20,000 | $0 |
| 2015 | -- | $20,000 | $20,000 | $0 |
| 2014 | -- | $20,000 | $20,000 | $0 |
Source: Public Records
Map
Nearby Homes