64 Sumner St Auburn, MA 01501
Stoneville NeighborhoodEstimated Value: $432,362 - $535,000
3
Beds
2
Baths
1,740
Sq Ft
$280/Sq Ft
Est. Value
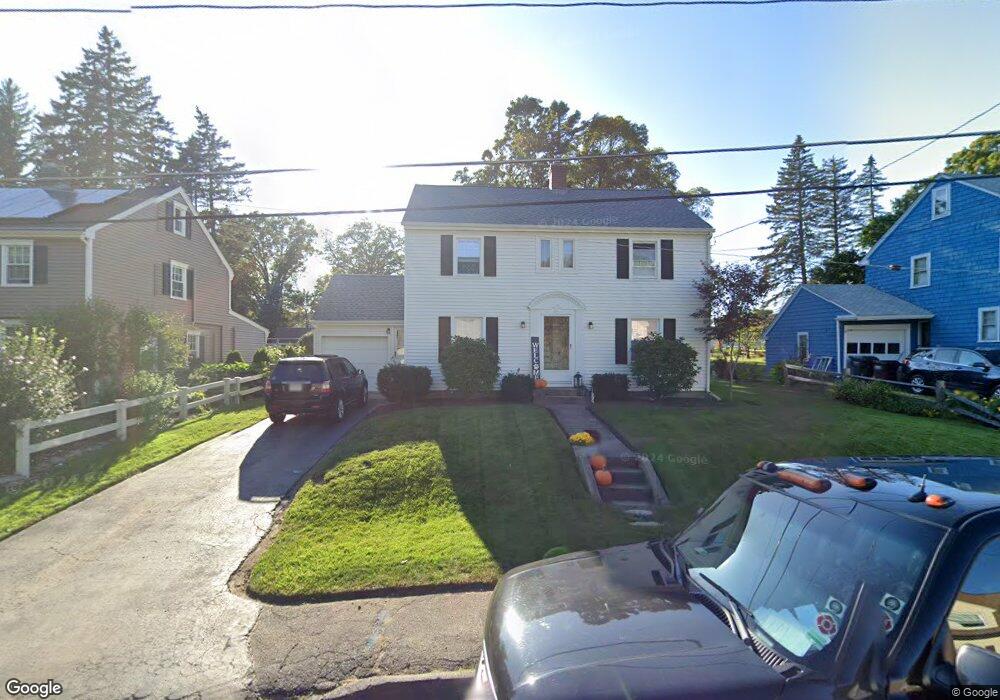
About This Home
This home is located at 64 Sumner St, Auburn, MA 01501 and is currently estimated at $487,591, approximately $280 per square foot. 64 Sumner St is a home located in Worcester County with nearby schools including Auburn Senior High School and Shrewsbury Montessori School - Auburn Campus.
Ownership History
Date
Name
Owned For
Owner Type
Purchase Details
Closed on
Jul 30, 2018
Sold by
Ford George G Est
Bought by
Ethier Matthew M and Ethier Amber
Current Estimated Value
Home Financials for this Owner
Home Financials are based on the most recent Mortgage that was taken out on this home.
Original Mortgage
$250,381
Outstanding Balance
$218,623
Interest Rate
4.75%
Mortgage Type
FHA
Estimated Equity
$268,968
Purchase Details
Closed on
Jun 11, 1965
Bought by
Ford George G
Create a Home Valuation Report for This Property
The Home Valuation Report is an in-depth analysis detailing your home's value as well as a comparison with similar homes in the area
Home Values in the Area
Average Home Value in this Area
Purchase History
| Date | Buyer | Sale Price | Title Company |
|---|---|---|---|
| Ethier Matthew M | $255,000 | -- | |
| Ford George G | -- | -- |
Source: Public Records
Mortgage History
| Date | Status | Borrower | Loan Amount |
|---|---|---|---|
| Open | Ethier Matthew M | $250,381 | |
| Previous Owner | Ford George G | $50,000 |
Source: Public Records
Tax History
| Year | Tax Paid | Tax Assessment Tax Assessment Total Assessment is a certain percentage of the fair market value that is determined by local assessors to be the total taxable value of land and additions on the property. | Land | Improvement |
|---|---|---|---|---|
| 2025 | $53 | $371,800 | $112,800 | $259,000 |
| 2024 | $5,548 | $371,600 | $106,900 | $264,700 |
| 2023 | $5,290 | $333,100 | $97,100 | $236,000 |
| 2022 | $4,910 | $291,900 | $97,100 | $194,800 |
| 2021 | $4,682 | $258,100 | $85,700 | $172,400 |
| 2020 | $4,641 | $258,100 | $85,700 | $172,400 |
| 2019 | $4,548 | $246,900 | $84,800 | $162,100 |
| 2018 | $4,365 | $236,700 | $79,300 | $157,400 |
| 2017 | $3,835 | $209,100 | $71,900 | $137,200 |
| 2016 | $3,759 | $207,800 | $75,100 | $132,700 |
| 2015 | $3,561 | $206,300 | $75,100 | $131,200 |
| 2014 | $3,465 | $200,400 | $71,500 | $128,900 |
Source: Public Records
Map
Nearby Homes
- 5 Commonwealth Ave
- 177 Boyce St
- 25 Vinal St Unit 28
- 25 Vinal St Unit 26
- 25 Vinal St Unit 29
- 25 Vinal St Unit 30
- 99 Clover St
- 1 Rockland Road Ct
- 177 Oxford St N
- 204-212 Hampton St
- 31-33 Walsh Ave
- 33 Walsh Ave
- 31 Walsh Ave
- 11 Hulbert Rd Unit 13
- 40 Bryn Mawr Ave
- 19-20 Williams St
- 154 Pakachoag St
- 1034 Southbridge St
- 6 Buron Terrace
- 27 Havana Rd
Your Personal Tour Guide
Ask me questions while you tour the home.