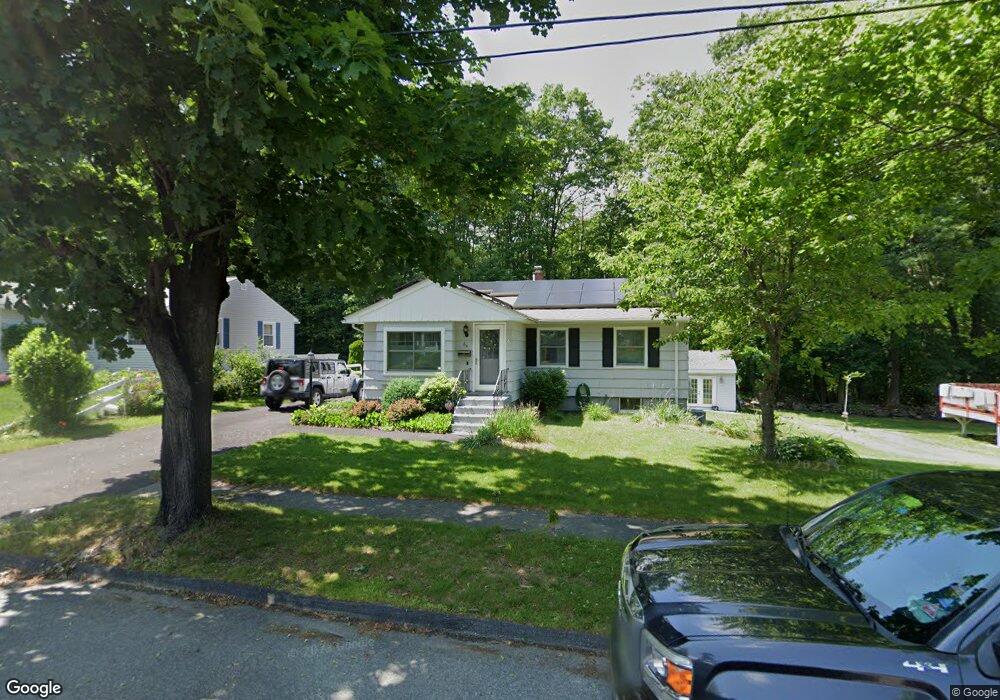
64 Sussex Ln Worcester, MA 01602
West Tatnuck NeighborhoodEstimated Value: $392,000 - $441,000
3
Beds
2
Baths
1,012
Sq Ft
$418/Sq Ft
Est. Value
About This Home
This home is located at 64 Sussex Ln, Worcester, MA 01602 and is currently estimated at $422,765, approximately $417 per square foot. 64 Sussex Ln is a home located in Worcester County with nearby schools including West Tatnuck School, Chandler Magnet, and Jacob Hiatt Magnet School.
Ownership History
Date
Name
Owned For
Owner Type
Purchase Details
Closed on
May 2, 2016
Sold by
Mockus Jason and Mockus Elizabeth
Bought by
Mockus Jason and Mockus Elizabeth
Current Estimated Value
Purchase Details
Closed on
Jun 26, 2008
Sold by
Oriordan Cornalijn E D and Oriordan Paul J
Bought by
Wood Elizabeth and Mockus Jason
Home Financials for this Owner
Home Financials are based on the most recent Mortgage that was taken out on this home.
Original Mortgage
$199,863
Interest Rate
6.07%
Mortgage Type
Purchase Money Mortgage
Purchase Details
Closed on
Sep 17, 1996
Sold by
Est Lange Theresa and Lange Henry J
Bought by
Oriordan Paul J and Oriordan Cornalijn
Home Financials for this Owner
Home Financials are based on the most recent Mortgage that was taken out on this home.
Original Mortgage
$77,850
Interest Rate
8.18%
Mortgage Type
Purchase Money Mortgage
Create a Home Valuation Report for This Property
The Home Valuation Report is an in-depth analysis detailing your home's value as well as a comparison with similar homes in the area
Home Values in the Area
Average Home Value in this Area
Purchase History
| Date | Buyer | Sale Price | Title Company |
|---|---|---|---|
| Mockus Jason | -- | -- | |
| Wood Elizabeth | $203,000 | -- | |
| Oriordan Paul J | $86,500 | -- |
Source: Public Records
Mortgage History
| Date | Status | Borrower | Loan Amount |
|---|---|---|---|
| Previous Owner | Wood Elizabeth | $199,863 | |
| Previous Owner | Oriordan Paul J | $38,000 | |
| Previous Owner | Oriordan Paul J | $88,000 | |
| Previous Owner | Oriordan Paul J | $77,850 |
Source: Public Records
Tax History Compared to Growth
Tax History
| Year | Tax Paid | Tax Assessment Tax Assessment Total Assessment is a certain percentage of the fair market value that is determined by local assessors to be the total taxable value of land and additions on the property. | Land | Improvement |
|---|---|---|---|---|
| 2025 | $4,649 | $352,500 | $118,200 | $234,300 |
| 2024 | $4,566 | $332,100 | $118,200 | $213,900 |
| 2023 | $4,410 | $307,500 | $102,700 | $204,800 |
| 2022 | $3,914 | $257,300 | $82,200 | $175,100 |
| 2021 | $3,881 | $238,400 | $65,800 | $172,600 |
| 2020 | $3,796 | $223,300 | $65,800 | $157,500 |
| 2019 | $3,569 | $198,300 | $59,200 | $139,100 |
| 2018 | $3,466 | $183,300 | $59,200 | $124,100 |
| 2017 | $3,502 | $182,200 | $59,200 | $123,000 |
| 2016 | $3,407 | $165,300 | $43,200 | $122,100 |
| 2015 | $3,318 | $165,300 | $43,200 | $122,100 |
| 2014 | $3,230 | $165,300 | $43,200 | $122,100 |
Source: Public Records
Map
Nearby Homes
- 58 Wedgewood Rd
- 5 Woodland Dr
- 5 Edwidge St
- 20 Wedgewood Rd
- 55 Central Ave
- 121 Bailey St Unit F52
- 10 Joppa Rd
- 27 Brewster Rd
- 44 Camp St
- 45 Camp St
- 15 Wildrose Ave
- 9 Newburn Rd
- 155 Tory Fort Ln
- 148A Tory Fort Ln
- 267 Pleasant St
- 12 Pinebrook Ln
- 309 Pleasant St
- 12 Copperfield Rd
- 25 Salisbury Hill Blvd Unit 64
- 25 Salisbury Hill Blvd Unit 69