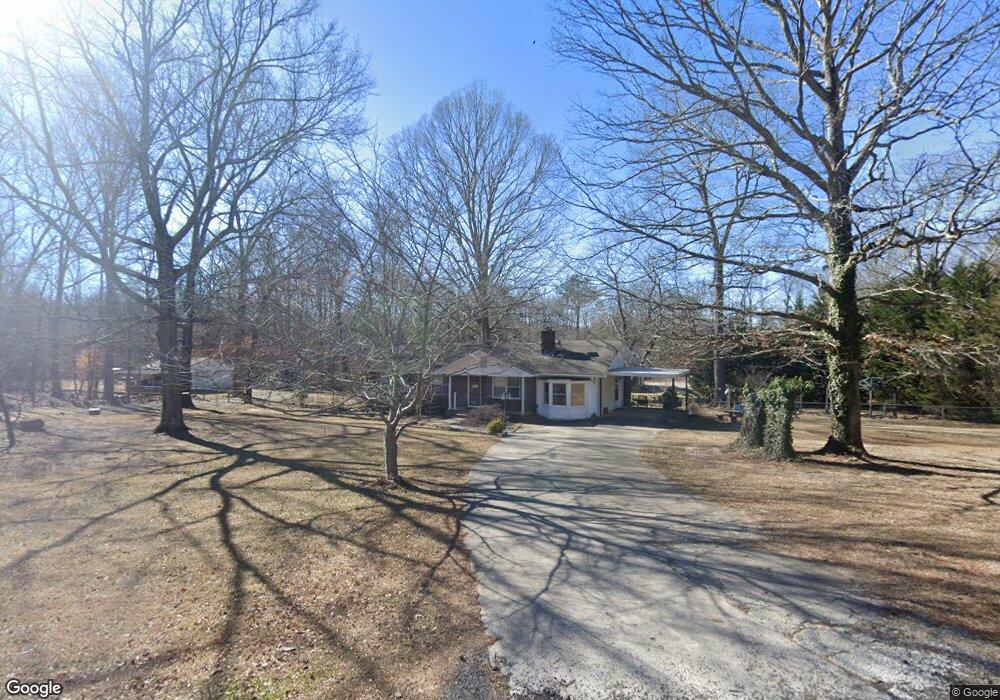
64 Tallapoosa Way Temple, GA 30179
Estimated Value: $284,000 - $407,542
2
Beds
2
Baths
1,528
Sq Ft
$219/Sq Ft
Est. Value
About This Home
This home is located at 64 Tallapoosa Way, Temple, GA 30179 and is currently estimated at $335,386, approximately $219 per square foot. 64 Tallapoosa Way is a home located in Paulding County with nearby schools including Union Elementary School, Carl Scoggins Sr. Middle School, and South Paulding High School.
Ownership History
Date
Name
Owned For
Owner Type
Purchase Details
Closed on
Jun 26, 2024
Sold by
Meyberg Windy
Bought by
Meyberg Phil
Current Estimated Value
Purchase Details
Closed on
Jan 17, 2003
Sold by
Meyberg Phil E and Meyberg Wendy S
Bought by
Meyberg Phil and Meyberg Windy S
Home Financials for this Owner
Home Financials are based on the most recent Mortgage that was taken out on this home.
Original Mortgage
$108,200
Interest Rate
5.98%
Mortgage Type
New Conventional
Purchase Details
Closed on
Aug 29, 2001
Sold by
Maples Orville V
Bought by
Meyberg Phil E and Meyberg Wendy S
Home Financials for this Owner
Home Financials are based on the most recent Mortgage that was taken out on this home.
Original Mortgage
$100,350
Interest Rate
6.74%
Mortgage Type
New Conventional
Create a Home Valuation Report for This Property
The Home Valuation Report is an in-depth analysis detailing your home's value as well as a comparison with similar homes in the area
Home Values in the Area
Average Home Value in this Area
Purchase History
| Date | Buyer | Sale Price | Title Company |
|---|---|---|---|
| Meyberg Phil | -- | -- | |
| Meyberg Phil | -- | -- | |
| Meyberg Phil E | $102,000 | -- |
Source: Public Records
Mortgage History
| Date | Status | Borrower | Loan Amount |
|---|---|---|---|
| Previous Owner | Meyberg Phil | $108,200 | |
| Previous Owner | Meyberg Phil E | $100,350 |
Source: Public Records
Tax History Compared to Growth
Tax History
| Year | Tax Paid | Tax Assessment Tax Assessment Total Assessment is a certain percentage of the fair market value that is determined by local assessors to be the total taxable value of land and additions on the property. | Land | Improvement |
|---|---|---|---|---|
| 2024 | $2,315 | $96,292 | $11,680 | $84,612 |
| 2023 | $2,309 | $91,104 | $11,120 | $79,984 |
| 2022 | $2,061 | $80,928 | $11,000 | $69,928 |
| 2021 | $1,830 | $64,844 | $7,840 | $57,004 |
| 2020 | $1,763 | $61,212 | $6,720 | $54,492 |
| 2019 | $1,590 | $54,640 | $5,840 | $48,800 |
| 2018 | $1,106 | $38,568 | $5,480 | $33,088 |
| 2017 | $1,032 | $35,660 | $5,480 | $30,180 |
| 2016 | $850 | $29,964 | $5,920 | $24,044 |
| 2015 | $862 | $29,852 | $5,920 | $23,932 |
| 2014 | $732 | $25,048 | $5,040 | $20,008 |
| 2013 | -- | $21,760 | $5,080 | $16,680 |
Source: Public Records
Map
Nearby Homes
- 10331 Buchanan Hwy
- 689 Hardin Rd
- 11070 Buchanan Hwy
- 836 Courthouse Park Dr Unit 13
- 0 Courthouse Park Dr Unit 10491475
- 221 Courthouse Park Dr
- 216 Lake Tanisha Dr
- 493 Courthouse Park Dr
- 502 Courthouse Park Dr
- 959 Georgia 101
- 957 Georgia 101
- 62 Rabon Trail
- 128 Tanner Dr
- 249 Wilson Rd
- 877 Georgia 101
- 0 Wilson Rd Unit 10638319
- 138 W Fork Way
- 391 Mulberry Rock Rd
- 207 Ivey Terrace
- 207 Ivey Terrace Unit 27
- 10577 Buchanan Hwy
- 100 Tallapoosa Way
- 10555 Buchanan Hwy
- 00 Tallapoosa Way
- 0 Tallapoosa Way
- 0 Tallapoosa Way Unit 7379976
- 0 Tallapoosa Way Unit 7124114
- 0 Tallapoosa Way Unit 2849603
- 0 Tallapoosa Way Unit 7628565
- 0 Tallapoosa Way Unit 8258601
- 32 Courthouse Rd
- 10479 Buchanan Hwy
- 00 Buchanan Hwy
- 10391 Buchanan Hwy
- 133 Tallapoosa Way
- 972 Courthouse Rd
- 10661 Buchanan Hwy
- 10417 Buchanan Hwy
- 981 Courthouse Rd
- 193 Tallapoosa Way