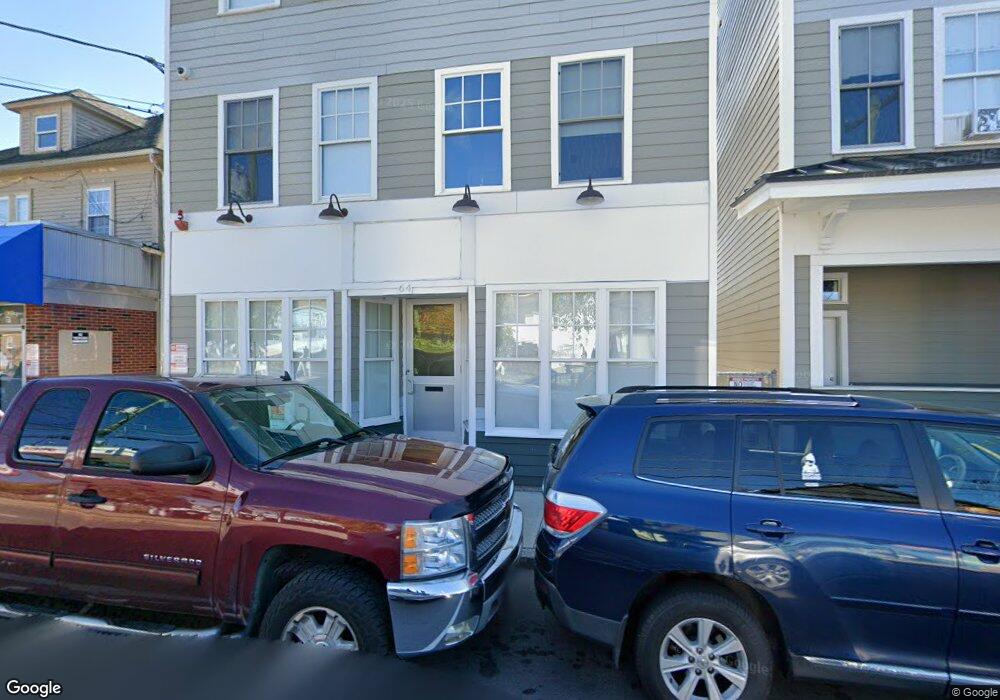
64 W Hollis St Nashua, NH 03060
South End Nashua Neighborhood
--
Bed
6
Baths
4,748
Sq Ft
3,485
Sq Ft Lot
About This Home
This home is located at 64 W Hollis St, Nashua, NH 03060. 64 W Hollis St is a home located in Hillsborough County with nearby schools including Ledge Street Elementary School, Elm Street Middle School, and Nashua High School South.
Ownership History
Date
Name
Owned For
Owner Type
Purchase Details
Closed on
Oct 14, 2016
Sold by
Willett Joshua and Willett Kristine
Bought by
West Hollis T and West Butler
Purchase Details
Closed on
Jun 16, 2011
Sold by
64 West Hollis St Ln T and Plante
Bought by
Willett Joshua and Willett Kristine
Purchase Details
Closed on
Mar 26, 1999
Sold by
Brisk Rlty Llc
Bought by
Night Magic Dev
Home Financials for this Owner
Home Financials are based on the most recent Mortgage that was taken out on this home.
Original Mortgage
$100,000
Interest Rate
6.78%
Mortgage Type
Commercial
Purchase Details
Closed on
Nov 21, 1997
Sold by
Chantal Ronald P
Bought by
Brisk Rlty Llc
Home Financials for this Owner
Home Financials are based on the most recent Mortgage that was taken out on this home.
Original Mortgage
$95,000
Interest Rate
7.17%
Mortgage Type
Commercial
Create a Home Valuation Report for This Property
The Home Valuation Report is an in-depth analysis detailing your home's value as well as a comparison with similar homes in the area
Home Values in the Area
Average Home Value in this Area
Purchase History
| Date | Buyer | Sale Price | Title Company |
|---|---|---|---|
| West Hollis T | $100,000 | -- | |
| Willett Joshua | $200,000 | -- | |
| Night Magic Dev | $179,000 | -- | |
| Brisk Rlty Llc | $70,000 | -- |
Source: Public Records
Mortgage History
| Date | Status | Borrower | Loan Amount |
|---|---|---|---|
| Previous Owner | Brisk Rlty Llc | $90,000 | |
| Previous Owner | Brisk Rlty Llc | $269,000 | |
| Previous Owner | Brisk Rlty Llc | $100,000 | |
| Previous Owner | Brisk Rlty Llc | $95,000 |
Source: Public Records
Tax History Compared to Growth
Tax History
| Year | Tax Paid | Tax Assessment Tax Assessment Total Assessment is a certain percentage of the fair market value that is determined by local assessors to be the total taxable value of land and additions on the property. | Land | Improvement |
|---|---|---|---|---|
| 2024 | $10,112 | $636,000 | $42,700 | $593,300 |
| 2023 | $9,846 | $540,100 | $37,200 | $502,900 |
| 2022 | $9,760 | $540,100 | $37,200 | $502,900 |
| 2021 | $11,006 | $474,000 | $35,400 | $438,600 |
| 2020 | $10,717 | $474,000 | $35,400 | $438,600 |
| 2019 | $10,314 | $474,000 | $35,400 | $438,600 |
| 2018 | $12,098 | $570,400 | $46,000 | $524,400 |
| 2017 | $689 | $26,700 | $26,700 | $0 |
| 2016 | $669 | $26,700 | $26,700 | $0 |
| 2015 | $5,877 | $239,600 | $26,700 | $212,900 |
| 2014 | $5,762 | $239,600 | $26,700 | $212,900 |
Source: Public Records
Map
Nearby Homes
- 71 Vine St Unit 713/4
- 8 Buck St Unit 10
- 38 Central St
- 29 Wilder St
- 30 Ledge St
- 121 Palm St
- 4 Badger St
- 24 E Otterson St
- 19.5 Balcom St
- 15 Lovell St Unit 20
- 15 Lovell St Unit 3
- 15 Lovell St Unit 10
- 169A W Hollis St Unit 193
- 32-34 Grand Ave
- 6 Lake Ave
- 16-18 Perry Ave
- 52 Main St Unit 402
- 30 Dexter St Unit 106
- 70 Linwood St
- 3 1/2 Beacon Ct