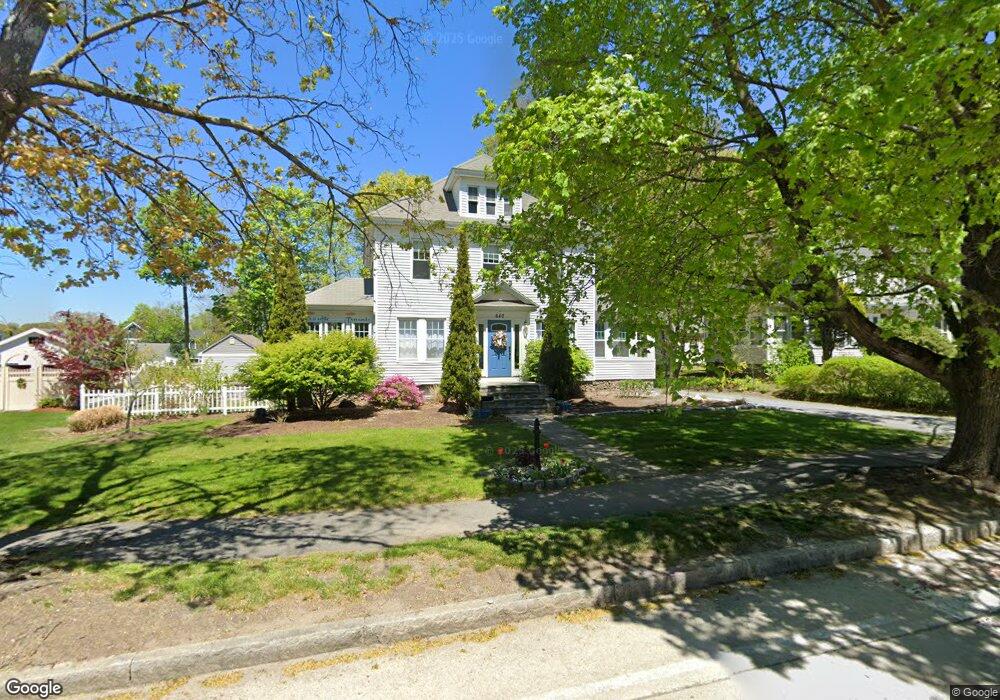
640 Andover St Lowell, MA 01852
Belvidere NeighborhoodEstimated Value: $671,000 - $788,000
3
Beds
2
Baths
1,893
Sq Ft
$375/Sq Ft
Est. Value
About This Home
This home is located at 640 Andover St, Lowell, MA 01852 and is currently estimated at $709,535, approximately $374 per square foot. 640 Andover St is a home located in Middlesex County with nearby schools including Moody Elementary School, Abraham Lincoln Elementary School, and Greenhalge Elementary School.
Ownership History
Date
Name
Owned For
Owner Type
Purchase Details
Closed on
Jan 28, 2025
Sold by
Fagone Joseph P and Fagone Nicole F
Bought by
Nj Fagone Ft and Fagone
Current Estimated Value
Purchase Details
Closed on
Mar 28, 2008
Sold by
Mccabe Amy Elizabeth
Bought by
Fagone Joseph P and Fagone Nicole F
Purchase Details
Closed on
Nov 25, 2002
Sold by
Moretti Lauren K and Moretti Paul C
Bought by
Mccabe Amy E and Mccabe Amy Elizabeth
Purchase Details
Closed on
Mar 17, 2000
Sold by
Chenelle David E and Chenelle Victoria L
Bought by
Moretti Paul C and Moretti Lauren K
Purchase Details
Closed on
Dec 5, 1997
Sold by
Dailey Donna L
Bought by
Chenelle David E
Create a Home Valuation Report for This Property
The Home Valuation Report is an in-depth analysis detailing your home's value as well as a comparison with similar homes in the area
Home Values in the Area
Average Home Value in this Area
Purchase History
| Date | Buyer | Sale Price | Title Company |
|---|---|---|---|
| Nj Fagone Ft | -- | -- | |
| Nj Fagone Ft | -- | -- | |
| Fagone Joseph P | $287,140 | -- | |
| Fagone Joseph P | $287,140 | -- | |
| Mccabe Amy E | $312,000 | -- | |
| Mccabe Amy E | $312,000 | -- | |
| Moretti Paul C | $265,000 | -- | |
| Moretti Paul C | $265,000 | -- | |
| Chenelle David E | $176,250 | -- | |
| Chenelle David E | $176,250 | -- |
Source: Public Records
Mortgage History
| Date | Status | Borrower | Loan Amount |
|---|---|---|---|
| Previous Owner | Chenelle David E | $58,000 | |
| Previous Owner | Chenelle David E | $253,498 |
Source: Public Records
Tax History Compared to Growth
Tax History
| Year | Tax Paid | Tax Assessment Tax Assessment Total Assessment is a certain percentage of the fair market value that is determined by local assessors to be the total taxable value of land and additions on the property. | Land | Improvement |
|---|---|---|---|---|
| 2025 | $6,957 | $606,000 | $251,700 | $354,300 |
| 2024 | $7,025 | $589,800 | $235,300 | $354,500 |
| 2023 | $6,610 | $532,200 | $204,600 | $327,600 |
| 2022 | $6,114 | $481,800 | $186,000 | $295,800 |
| 2021 | $5,711 | $424,300 | $161,700 | $262,600 |
| 2020 | $5,520 | $413,200 | $161,700 | $251,500 |
| 2019 | $5,737 | $408,600 | $160,900 | $247,700 |
| 2018 | $5,687 | $395,200 | $153,300 | $241,900 |
| 2017 | $5,446 | $365,000 | $142,300 | $222,700 |
| 2016 | $5,359 | $353,500 | $130,800 | $222,700 |
| 2015 | $5,116 | $330,500 | $130,800 | $199,700 |
| 2013 | $4,908 | $327,000 | $144,300 | $182,700 |
Source: Public Records
Map
Nearby Homes
- 26 Luce St
- 45 Clark Rd
- 45 Luce St
- 111 Draper St
- 15 Sharyn Cir
- 16 Winding Ln
- 288 Hovey St
- 16 Wetherbee Ave
- 4 Glenmere St
- 70 Enfield St
- 251 Clark Rd
- 100 Merrimack Ave Unit 91
- 100 Merrimack Ave Unit 124
- 11 Merrimack Meadows Ln Unit 17
- 318 Andover St
- 173 Merrimack Meadows Ln Unit 162
- 78 Merrimack Meadows Ln Unit 78
- 53 Fairmount St
- 216 Nesmith St Unit 2
- 21 Vernon St