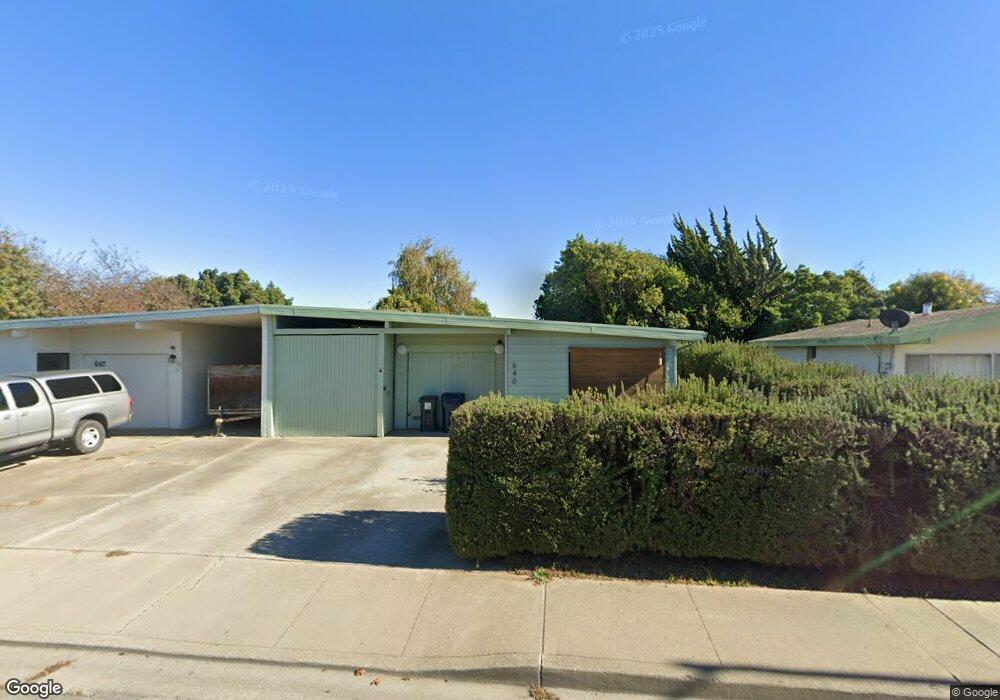
640 Bridge St Watsonville, CA 95076
Estimated Value: $501,000 - $547,568
2
Beds
1
Bath
766
Sq Ft
$674/Sq Ft
Est. Value
About This Home
This home is located at 640 Bridge St, Watsonville, CA 95076 and is currently estimated at $516,642, approximately $674 per square foot. 640 Bridge St is a home located in Santa Cruz County with nearby schools including Ann Soldo Elementary School, Lakeview Middle School, and Watsonville High School.
Ownership History
Date
Name
Owned For
Owner Type
Purchase Details
Closed on
Feb 8, 2019
Sold by
Bruton James Walter
Bought by
Bruton James Walter and Whiteley Lola
Current Estimated Value
Purchase Details
Closed on
Apr 8, 2011
Sold by
Jonassen John
Bought by
Bruton James Walter
Home Financials for this Owner
Home Financials are based on the most recent Mortgage that was taken out on this home.
Original Mortgage
$141,324
Outstanding Balance
$97,273
Interest Rate
4.75%
Mortgage Type
FHA
Estimated Equity
$419,369
Purchase Details
Closed on
Jul 17, 2002
Sold by
Bye Sibyll L and Bye Maury R
Bought by
Jonassen John
Home Financials for this Owner
Home Financials are based on the most recent Mortgage that was taken out on this home.
Original Mortgage
$144,000
Interest Rate
5.36%
Create a Home Valuation Report for This Property
The Home Valuation Report is an in-depth analysis detailing your home's value as well as a comparison with similar homes in the area
Home Values in the Area
Average Home Value in this Area
Purchase History
| Date | Buyer | Sale Price | Title Company |
|---|---|---|---|
| Bruton James Walter | -- | None Available | |
| Bruton James Walter | $145,000 | First American Title Company | |
| Jonassen John | $180,000 | Santa Cruz Title Company |
Source: Public Records
Mortgage History
| Date | Status | Borrower | Loan Amount |
|---|---|---|---|
| Open | Bruton James Walter | $141,324 | |
| Previous Owner | Jonassen John | $144,000 |
Source: Public Records
Tax History Compared to Growth
Tax History
| Year | Tax Paid | Tax Assessment Tax Assessment Total Assessment is a certain percentage of the fair market value that is determined by local assessors to be the total taxable value of land and additions on the property. | Land | Improvement |
|---|---|---|---|---|
| 2025 | $2,364 | $185,771 | $111,463 | $74,308 |
| 2023 | $2,324 | $178,557 | $107,134 | $71,423 |
| 2022 | $2,277 | $175,056 | $105,034 | $70,022 |
| 2021 | $2,129 | $171,623 | $102,974 | $68,649 |
| 2020 | $2,100 | $169,864 | $101,918 | $67,946 |
| 2019 | $2,063 | $166,533 | $99,920 | $66,613 |
| 2018 | $2,011 | $163,268 | $97,961 | $65,307 |
| 2017 | $1,993 | $160,066 | $96,040 | $64,026 |
| 2016 | $1,941 | $156,928 | $94,157 | $62,771 |
| 2015 | $1,934 | $154,571 | $92,743 | $61,828 |
| 2014 | $1,893 | $151,543 | $90,926 | $60,617 |
Source: Public Records
Map
Nearby Homes