640 Main Rd Westport, MA 02790
Booth/Handy Four Corners NeighborhoodEstimated Value: $625,000 - $643,000
About This Home
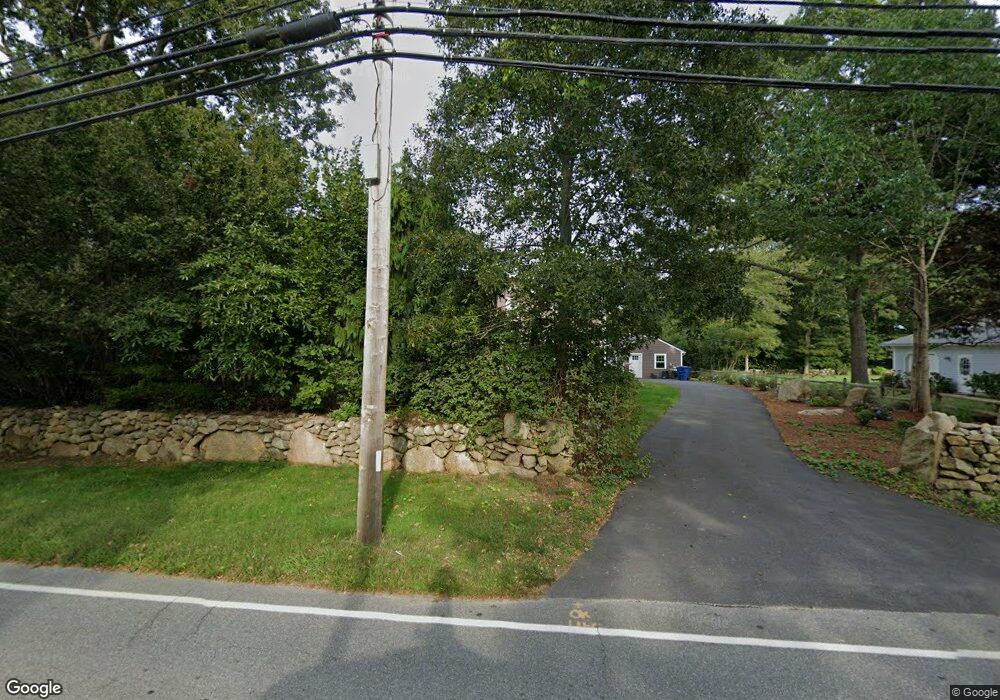
This home is located at 640 Main Rd, Westport, MA 02790 and is currently estimated at $636,345, approximately $514 per square foot. 640 Main Rd is a home located in Bristol County with nearby schools including Alice A. Macomber Primary School, Westport Elementary School, and Westport Middle-High School.
Ownership History
We collect this data history from publicly available records. To have your information removed, we recommend requesting removal directly through your county’s website.
Purchase Details
Home Financials for this Owner
Home Financials are based on the most recent Mortgage that was taken out on this home.Purchase Details
Purchase Details
Purchase Details
Home Values in the Area
Average Home Value in this Area
Purchase History
We collect this data history from publicly available records. To have your information removed, we recommend requesting removal directly through your county’s website.
| Date | Buyer | Sale Price | Title Company |
|---|---|---|---|
| $267,500 | -- | ||
| -- | -- | ||
| $145,000 | -- | ||
| $50,000 | -- | ||
| $220,000 | -- |
Mortgage History
We collect this data history from publicly available records. To have your information removed, we recommend requesting removal directly through your county’s website.
| Date | Status | Borrower | Loan Amount |
|---|---|---|---|
| Open | $235,500 | ||
| Closed | $244,963 | ||
| Previous Owner | $244,500 |
Tax History
We collect this data history from publicly available records. To have your information removed, we recommend requesting removal directly through your county’s website.
| Year | Tax Paid | Tax Assessment Tax Assessment Total Assessment is a certain percentage of the fair market value that is determined by local assessors to be the total taxable value of land and additions on the property. | Land | Improvement |
|---|---|---|---|---|
| 2025 | $3,502 | $470,100 | $192,000 | $278,100 |
| 2024 | $3,444 | $445,600 | $171,100 | $274,500 |
| 2023 | $3,237 | $396,700 | $148,600 | $248,100 |
| 2022 | $2,628 | $368,600 | $148,600 | $220,000 |
| 2021 | $127,813 | $304,900 | $129,300 | $175,600 |
| 2020 | $125,281 | $263,300 | $118,000 | $145,300 |
| 2019 | $2,093 | $253,100 | $118,000 | $135,100 |
| 2018 | $134,244 | $262,000 | $129,000 | $133,000 |
| 2017 | $2,033 | $255,100 | $125,300 | $129,800 |
| 2016 | $1,925 | $243,400 | $121,500 | $121,900 |
| 2015 | $1,813 | $228,600 | $124,000 | $104,600 |
Map
- 51 Holly Ln
- 54 Holly Ln
- 32 Village Way
- 612 Drift Rd
- 101 Meadowbrook Ln
- 922 Drift Rd
- 38 Bayberry Dr
- 12 Old Pasture Ln
- 920 Drift Rd
- 978 Sodom Rd
- 250 Main Rd
- 225 Hixbridge Rd
- 45 Marcotte Unit Lot 7
- 272 Pine Hill Rd
- 408 Hixbridge Rd
- 171 Pine Hill Rd
- 6 Angel Ct
- 170 Saxony Ave
- 178 Pine Hill Rd
- 214 Sawdy Dr
Ask me questions while you tour the home.