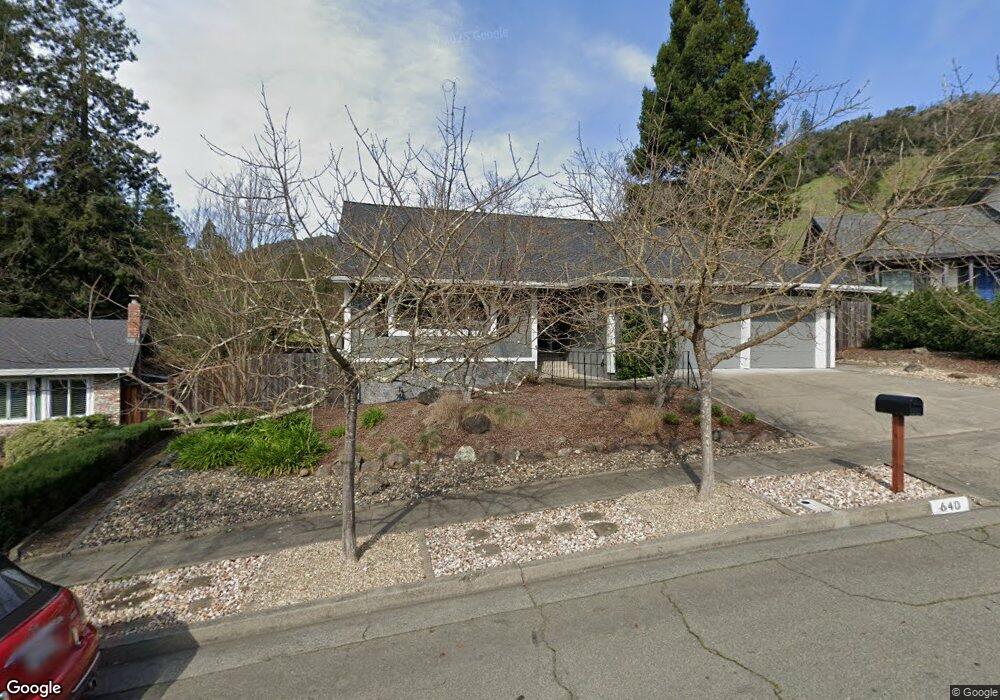
640 Rinaldo St Santa Rosa, CA 95409
Skyhawk NeighborhoodEstimated Value: $874,000 - $968,288
2
Beds
2
Baths
1,860
Sq Ft
$497/Sq Ft
Est. Value
About This Home
This home is located at 640 Rinaldo St, Santa Rosa, CA 95409 and is currently estimated at $923,572, approximately $496 per square foot. 640 Rinaldo St is a home located in Sonoma County with nearby schools including Sequoia Elementary School, Rincon Valley Middle School, and Maria Carrillo High School.
Ownership History
Date
Name
Owned For
Owner Type
Purchase Details
Closed on
Dec 12, 2018
Sold by
Bianucci Kenneth F and Bianucci Bonnie G
Bought by
Bianucci Kenneth F and Bianucci Bonnie G
Current Estimated Value
Home Financials for this Owner
Home Financials are based on the most recent Mortgage that was taken out on this home.
Original Mortgage
$300,000
Outstanding Balance
$264,306
Interest Rate
4.8%
Mortgage Type
New Conventional
Estimated Equity
$659,266
Purchase Details
Closed on
Dec 5, 2018
Sold by
White James E
Bought by
Bianucci Kenneth F and Bianucci Bonnie G
Home Financials for this Owner
Home Financials are based on the most recent Mortgage that was taken out on this home.
Original Mortgage
$300,000
Outstanding Balance
$264,306
Interest Rate
4.8%
Mortgage Type
New Conventional
Estimated Equity
$659,266
Purchase Details
Closed on
Jan 25, 1996
Sold by
White James E and White Marsha M
Bought by
White James E and White Marsha M
Purchase Details
Closed on
Feb 1, 1994
Sold by
White James E and White Marsha M
Bought by
White James E and White Marsha M
Create a Home Valuation Report for This Property
The Home Valuation Report is an in-depth analysis detailing your home's value as well as a comparison with similar homes in the area
Home Values in the Area
Average Home Value in this Area
Purchase History
| Date | Buyer | Sale Price | Title Company |
|---|---|---|---|
| Bianucci Kenneth F | -- | None Available | |
| Bianucci Kenneth F | $785,000 | North Coast Title Co | |
| White James E | -- | -- | |
| White James E | -- | -- |
Source: Public Records
Mortgage History
| Date | Status | Borrower | Loan Amount |
|---|---|---|---|
| Open | Bianucci Kenneth F | $300,000 |
Source: Public Records
Tax History Compared to Growth
Tax History
| Year | Tax Paid | Tax Assessment Tax Assessment Total Assessment is a certain percentage of the fair market value that is determined by local assessors to be the total taxable value of land and additions on the property. | Land | Improvement |
|---|---|---|---|---|
| 2025 | $10,570 | $919,424 | $350,271 | $569,153 |
| 2024 | $10,570 | $901,397 | $343,403 | $557,994 |
| 2023 | $10,570 | $883,723 | $336,670 | $547,053 |
| 2022 | $9,773 | $866,396 | $330,069 | $536,327 |
| 2021 | $9,539 | $849,409 | $323,598 | $525,811 |
| 2020 | $9,504 | $840,700 | $320,280 | $520,420 |
| 2019 | $9,075 | $785,000 | $314,000 | $471,000 |
| 2018 | $3,289 | $286,354 | $111,431 | $174,923 |
| 2017 | $3,228 | $280,741 | $109,247 | $171,494 |
| 2016 | $3,189 | $275,237 | $107,105 | $168,132 |
| 2015 | $3,093 | $271,104 | $105,497 | $165,607 |
| 2014 | $2,980 | $265,794 | $103,431 | $162,363 |
Source: Public Records
Map
Nearby Homes
- 5209 San Luis Ave
- 29 Coronado Cir
- 5243 Beaumont Way
- 66 Coronado Cir
- 61 Coronado Cir
- 31 Springhill Ct
- 28 Springhill Ct
- 537 Emerald Park Ct
- 48 Shadyleaf Ct
- 71 Oakcreek Ct
- 52 Oakstone Ct Unit 52
- 164 Brookview Ct
- 103 Glenoak Ct
- 5518 Marit Dr
- 305 Simone Place N
- 311 Algiers Ct
- 5015 Charmian Dr
- 184 El Encanto Way
- 1826 San Ramon Way
- 5086 Charmian Dr
- 636 Rinaldo St
- 644 Rinaldo St
- 5250 Piedmont Ct
- 632 Rinaldo St
- 648 Rinaldo St
- 637 Rinaldo St
- 5246 Piedmont Ct
- 649 Rinaldo St
- 631 Rinaldo St
- 628 Rinaldo St
- 652 Rinaldo St
- 5251 Piedmont Ct
- 5240 Piedmont Ct
- 653 Rinaldo St
- 624 Crestmont Dr
- 625 Rinaldo St
- 624 Rinaldo St
- 5247 Piedmont Ct
- 656 Rinaldo St
- 646 Crestmont Dr