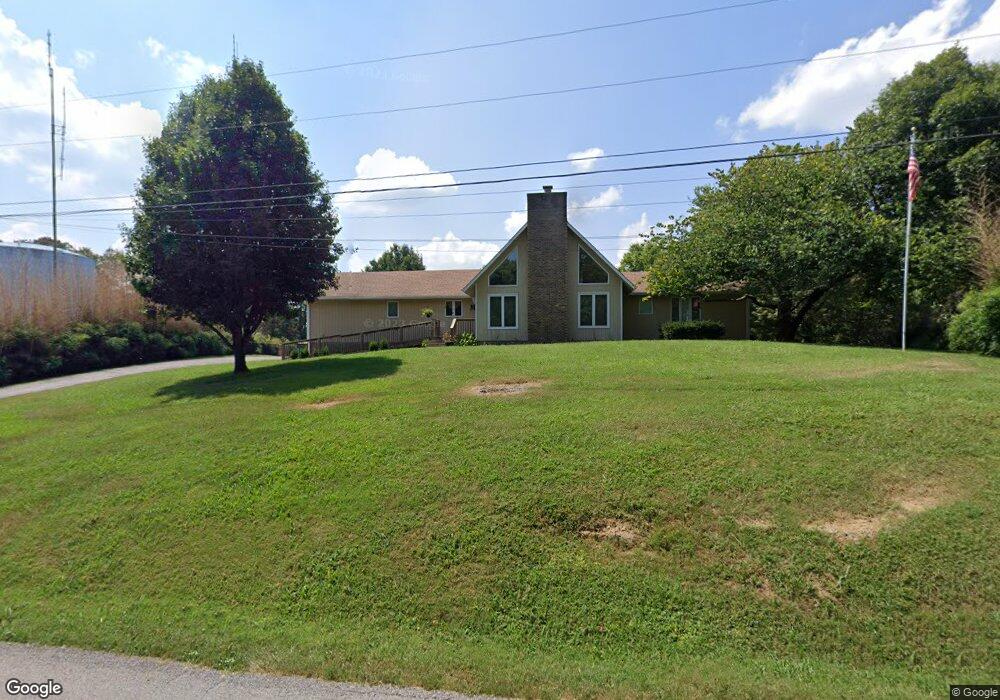
640 Skyline Dr S Lewisburg, TN 37091
Estimated Value: $371,000 - $433,000
--
Bed
3
Baths
2,276
Sq Ft
$177/Sq Ft
Est. Value
About This Home
This home is located at 640 Skyline Dr S, Lewisburg, TN 37091 and is currently estimated at $402,193, approximately $176 per square foot. 640 Skyline Dr S is a home located in Marshall County with nearby schools including Marshall Elementary School, Oak Grove Elementary School, and Westhills Elementary School.
Ownership History
Date
Name
Owned For
Owner Type
Purchase Details
Closed on
Jan 15, 2013
Sold by
Federal Home Loan Mortgage Corporation
Bought by
Murdock Cynthia L
Current Estimated Value
Home Financials for this Owner
Home Financials are based on the most recent Mortgage that was taken out on this home.
Original Mortgage
$52,910
Outstanding Balance
$36,840
Interest Rate
3.4%
Mortgage Type
Commercial
Estimated Equity
$365,353
Purchase Details
Closed on
Oct 24, 2012
Sold by
Fellows Michael L
Bought by
Federal Home Loan Mortgage Corporation
Purchase Details
Closed on
Mar 7, 2008
Sold by
And Fellows Richard Dale
Bought by
Michael Fellows
Home Financials for this Owner
Home Financials are based on the most recent Mortgage that was taken out on this home.
Original Mortgage
$127,500
Interest Rate
5.62%
Purchase Details
Closed on
Nov 3, 2006
Sold by
Fellows Richard D
Bought by
Fellows Richard Dale and Fellows Michael
Purchase Details
Closed on
Jun 28, 2000
Sold by
Fagan Douglas E
Bought by
Richard Fellows and Richard Michael
Create a Home Valuation Report for This Property
The Home Valuation Report is an in-depth analysis detailing your home's value as well as a comparison with similar homes in the area
Home Values in the Area
Average Home Value in this Area
Purchase History
| Date | Buyer | Sale Price | Title Company |
|---|---|---|---|
| Murdock Cynthia L | $94,900 | -- | |
| Federal Home Loan Mortgage Corporation | $110,257 | -- | |
| Michael Fellows | -- | -- | |
| Fellows Richard Dale | -- | -- | |
| Richard Fellows | $144,900 | -- |
Source: Public Records
Mortgage History
| Date | Status | Borrower | Loan Amount |
|---|---|---|---|
| Open | Murdock Cynthia L | $52,910 | |
| Previous Owner | Richard Fellows | $127,500 |
Source: Public Records
Tax History Compared to Growth
Tax History
| Year | Tax Paid | Tax Assessment Tax Assessment Total Assessment is a certain percentage of the fair market value that is determined by local assessors to be the total taxable value of land and additions on the property. | Land | Improvement |
|---|---|---|---|---|
| 2024 | -- | $72,400 | $8,750 | $63,650 |
| 2023 | $2,247 | $72,400 | $8,750 | $63,650 |
| 2022 | $2,247 | $72,400 | $8,750 | $63,650 |
| 2021 | $1,980 | $42,575 | $6,875 | $35,700 |
| 2020 | $1,980 | $42,575 | $6,875 | $35,700 |
| 2019 | $1,917 | $42,575 | $6,875 | $35,700 |
| 2018 | $1,896 | $42,575 | $6,875 | $35,700 |
| 2017 | $1,896 | $42,575 | $6,875 | $35,700 |
| 2016 | $1,874 | $36,600 | $5,000 | $31,600 |
| 2015 | $1,709 | $36,600 | $5,000 | $31,600 |
| 2014 | $1,709 | $36,600 | $5,000 | $31,600 |
Source: Public Records
Map
Nearby Homes
- 541 Skyline Dr S
- 750 Lakehill Cir
- 475 Skyline Dr
- 530 David Ave
- 486 David Ave
- 425 Centennial Ave
- 2090 Wild Cherry Dr
- 2085 Wild Cherry Dr
- 2080 Wild Cherry Dr
- 2095 Phillips St
- 795 Ashwood Ave
- 575 Joyce Cir
- 601 Joyce Ave
- 1710 Collins Hollow Rd
- 1821 Gina Lynn Dr
- 1320 Rambo Hollow Rd
- 0 Collins Hollow Rd
- 0 W Ellington Pkwy
- 0 Joyce Ave
- 347 Oakwood Dr
- 620 Skyline Dr S
- 600 Skyline Dr S
- 601 Skyline Dr S
- 704 Skyline Dr S
- 560 Skyline Dr S
- 561 Skyline Dr S
- 720 Skyline Dr S
- 540 Skyline Dr S
- 711 Fawn Cir
- 1851 Lowe St
- 520 Skyline Dr S
- 521 Skyline Dr S
- 1880 Lakehill Cir
- 710 Fawn Cir
- 729 Skyline Dr S
- 1890 Lakehill Cir
- 725 Skyline Dr S
- 1860 Lowe St
- 1860 Lowe St Unit B
- 500 Skyline Dr S