Estimated Value: $415,000 - $479,000
3
Beds
2
Baths
2,319
Sq Ft
$191/Sq Ft
Est. Value
About This Home
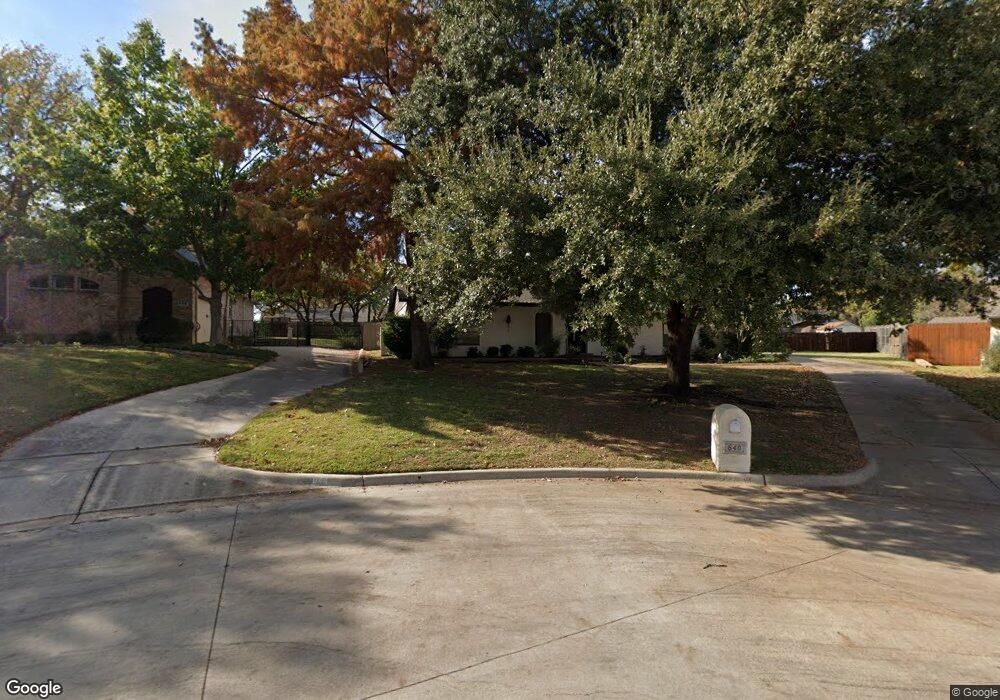
This home is located at 640 Springhill Ct, Hurst, TX 76054 and is currently estimated at $443,307, approximately $191 per square foot. 640 Springhill Ct is a home located in Tarrant County with nearby schools including W.A. Porter Elementary School, Smithfield Middle School, and Birdville High School.
Ownership History
Date
Name
Owned For
Owner Type
Purchase Details
Closed on
Aug 15, 2016
Sold by
Goodgion Faye S
Bought by
Goodgion Faye S and Faye S Goodgion Family Trust
Current Estimated Value
Purchase Details
Closed on
Oct 25, 2011
Sold by
Pickett Keith
Bought by
Goodgion Faye
Purchase Details
Closed on
Jun 15, 2005
Sold by
Pitner John L and Pitner Laurie Ann
Bought by
Pickett Keith
Home Financials for this Owner
Home Financials are based on the most recent Mortgage that was taken out on this home.
Original Mortgage
$129,600
Interest Rate
5.78%
Mortgage Type
Fannie Mae Freddie Mac
Purchase Details
Closed on
Feb 3, 2003
Sold by
Pitner John L
Bought by
Pitner John L and Pitner Laurie Ann
Purchase Details
Closed on
Jan 27, 2003
Sold by
Pitner Patricia
Bought by
Pitner John L
Create a Home Valuation Report for This Property
The Home Valuation Report is an in-depth analysis detailing your home's value as well as a comparison with similar homes in the area
Home Values in the Area
Average Home Value in this Area
Purchase History
| Date | Buyer | Sale Price | Title Company |
|---|---|---|---|
| Goodgion Faye S | -- | None Available | |
| Goodgion Faye | -- | Providence Title | |
| Pickett Keith | -- | Metroplex Title Inc | |
| Pitner John L | -- | -- | |
| Pitner John L | -- | -- |
Source: Public Records
Mortgage History
| Date | Status | Borrower | Loan Amount |
|---|---|---|---|
| Previous Owner | Pickett Keith | $129,600 |
Source: Public Records
Tax History
| Year | Tax Paid | Tax Assessment Tax Assessment Total Assessment is a certain percentage of the fair market value that is determined by local assessors to be the total taxable value of land and additions on the property. | Land | Improvement |
|---|---|---|---|---|
| 2025 | $7,285 | $302,000 | $75,000 | $227,000 |
| 2024 | $7,285 | $320,659 | $75,000 | $245,659 |
| 2023 | $6,742 | $295,000 | $75,000 | $220,000 |
| 2022 | $6,161 | $249,184 | $40,000 | $209,184 |
| 2021 | $5,350 | $206,225 | $40,000 | $166,225 |
| 2020 | $6,579 | $256,001 | $40,000 | $216,001 |
| 2019 | $6,729 | $256,000 | $40,000 | $216,000 |
| 2018 | $6,521 | $248,087 | $40,000 | $208,087 |
| 2017 | $5,986 | $224,331 | $40,000 | $184,331 |
| 2016 | $5,260 | $197,122 | $35,000 | $162,122 |
| 2015 | $4,450 | $192,000 | $35,000 | $157,000 |
| 2014 | $4,450 | $165,900 | $20,000 | $145,900 |
Source: Public Records
Map
Nearby Homes
- 712 Springhill Dr
- 2925 Ridgewood Dr
- 736 Springhill Dr
- 753 Toni Dr
- 9120 Nob Hill Dr
- 6704 Nob Hill Ct
- 2620 Brookridge Dr
- 6708 Nob Hill Ct
- 6812 Switchback Trail
- 3121 Oakdale Dr
- 717 Ashley Dr
- 6625 Crane Rd
- 6505 Parkway Ave
- 6350 Rogers Dr
- 6400 Rogers Dr
- 3220 David Dr
- 2244 Hurstview Dr
- 8920 Martin Dr
- 104 Greenbriar Ln
- 3229 David Dr
- 636 Springhill Ct
- 644 Springhill Ct
- 2812 Autumn Dr
- 2808 Autumn Dr
- 2816 Autumn Dr
- 2804 Autumn Dr
- 648 Springhill Ct
- 2824 Toni Ct
- 632 Springhill Ct
- 2828 Toni Ct
- 668 Springhill Dr
- 664 Springhill Dr
- 2820 Toni Ct
- 660 Springhill Dr
- 672 Springhill Dr
- 628 Springhill Ct
- 2832 Toni Ct
- 2813 Autumn Dr
- 2817 Autumn Dr
- 2809 Autumn Dr
Your Personal Tour Guide
Ask me questions while you tour the home.