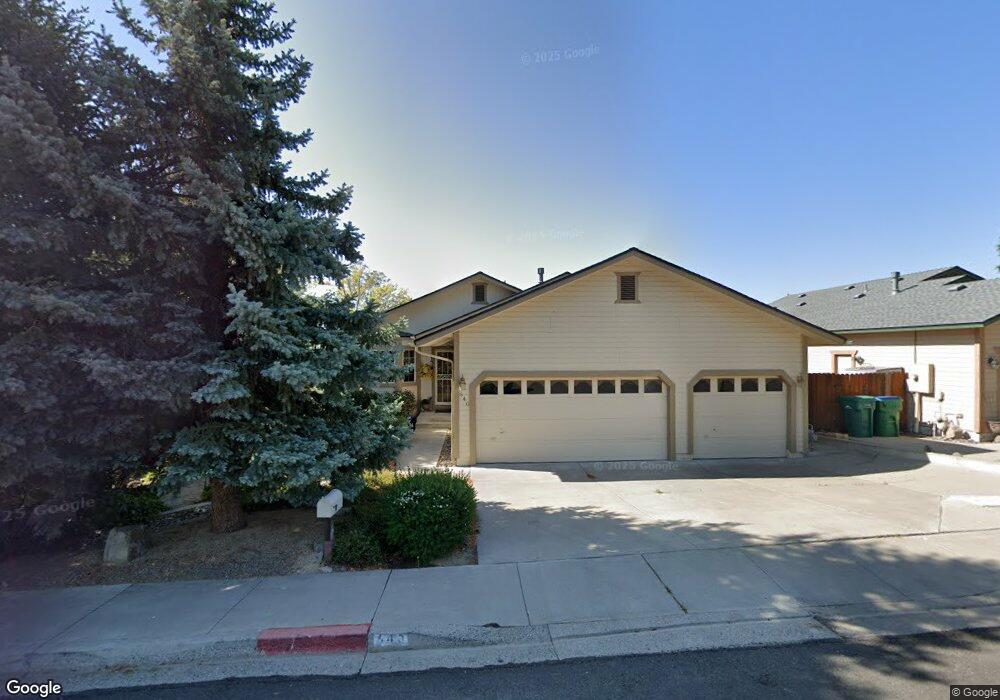
640 Tarn Way Reno, NV 89503
West University NeighborhoodEstimated Value: $514,063 - $639,000
3
Beds
3
Baths
1,151
Sq Ft
$498/Sq Ft
Est. Value
About This Home
This home is located at 640 Tarn Way, Reno, NV 89503 and is currently estimated at $572,766, approximately $497 per square foot. 640 Tarn Way is a home located in Washoe County with nearby schools including Elmcrest Elementary School, Archie Clayton Pre-AP Academy, and Coral Academy Charter School Elementary.
Ownership History
Date
Name
Owned For
Owner Type
Purchase Details
Closed on
Aug 6, 1998
Sold by
Andrews Cheryl Lynn and Andrews Cheryl L
Bought by
Andrews Cheryl Lynn
Current Estimated Value
Home Financials for this Owner
Home Financials are based on the most recent Mortgage that was taken out on this home.
Original Mortgage
$168,000
Outstanding Balance
$35,078
Interest Rate
6.93%
Estimated Equity
$537,688
Purchase Details
Closed on
Apr 16, 1996
Sold by
Andrews Cheryl L and Corron Cheryl L
Bought by
Andrews Cheryl L
Purchase Details
Closed on
May 6, 1994
Sold by
Corron Craig Ryan
Bought by
Corron Cheryl L
Purchase Details
Closed on
Nov 22, 1993
Sold by
Murphy C M and Cavallero Ken
Bought by
Corron Craig and Corron Cheryl
Home Financials for this Owner
Home Financials are based on the most recent Mortgage that was taken out on this home.
Original Mortgage
$149,174
Interest Rate
6.74%
Create a Home Valuation Report for This Property
The Home Valuation Report is an in-depth analysis detailing your home's value as well as a comparison with similar homes in the area
Home Values in the Area
Average Home Value in this Area
Purchase History
| Date | Buyer | Sale Price | Title Company |
|---|---|---|---|
| Andrews Cheryl Lynn | -- | Founders Title Co | |
| Andrews Cheryl L | -- | Western Title Company Inc | |
| Corron Cheryl L | -- | -- | |
| Corron Craig | $161,000 | First Centennial Title Co |
Source: Public Records
Mortgage History
| Date | Status | Borrower | Loan Amount |
|---|---|---|---|
| Open | Andrews Cheryl Lynn | $168,000 | |
| Previous Owner | Corron Craig | $149,174 |
Source: Public Records
Tax History Compared to Growth
Tax History
| Year | Tax Paid | Tax Assessment Tax Assessment Total Assessment is a certain percentage of the fair market value that is determined by local assessors to be the total taxable value of land and additions on the property. | Land | Improvement |
|---|---|---|---|---|
| 2025 | $3,136 | $116,792 | $48,846 | $67,946 |
| 2024 | $3,136 | $117,220 | $48,174 | $69,046 |
| 2023 | $3,045 | $110,666 | $44,235 | $66,431 |
| 2022 | $2,957 | $101,731 | $46,988 | $54,744 |
| 2021 | $2,870 | $86,904 | $32,130 | $54,774 |
| 2020 | $2,785 | $92,040 | $36,120 | $55,920 |
| 2019 | $2,704 | $85,871 | $32,288 | $53,583 |
| 2018 | $2,626 | $76,233 | $23,468 | $52,765 |
| 2017 | $2,550 | $75,048 | $22,050 | $52,998 |
| 2016 | $2,486 | $77,527 | $24,194 | $53,333 |
| 2015 | $2,481 | $76,293 | $21,840 | $54,453 |
| 2014 | $2,408 | $72,786 | $19,670 | $53,116 |
| 2013 | -- | $59,928 | $16,695 | $43,233 |
Source: Public Records
Map
Nearby Homes
- 785 Talus Way
- 531 Tarn Way
- 3696 Shale Ct
- 400 Tarn Way
- 3200 Lodestar Ln
- 200 Talus Way Unit 232
- 200 Talus Way Unit 234
- 200 Talus Way Unit 522
- 200 Talus Way Unit 123
- 230 Bisset Ct Unit B
- 100 Bisset Ct Unit B
- 139 Vista Rafael Pkwy Unit 53
- 147 Vista Rafael Pkwy
- 4795 Ciarra Kennedy Ln
- 5030 Ronald Stephen Cir
- 4685 Sarah Beth Ln
- 585 Logan Jacob Ln
- 555 Logan Jacob Ln
- 3495 Comstock Dr
- 31 Vista Rafael Pkwy