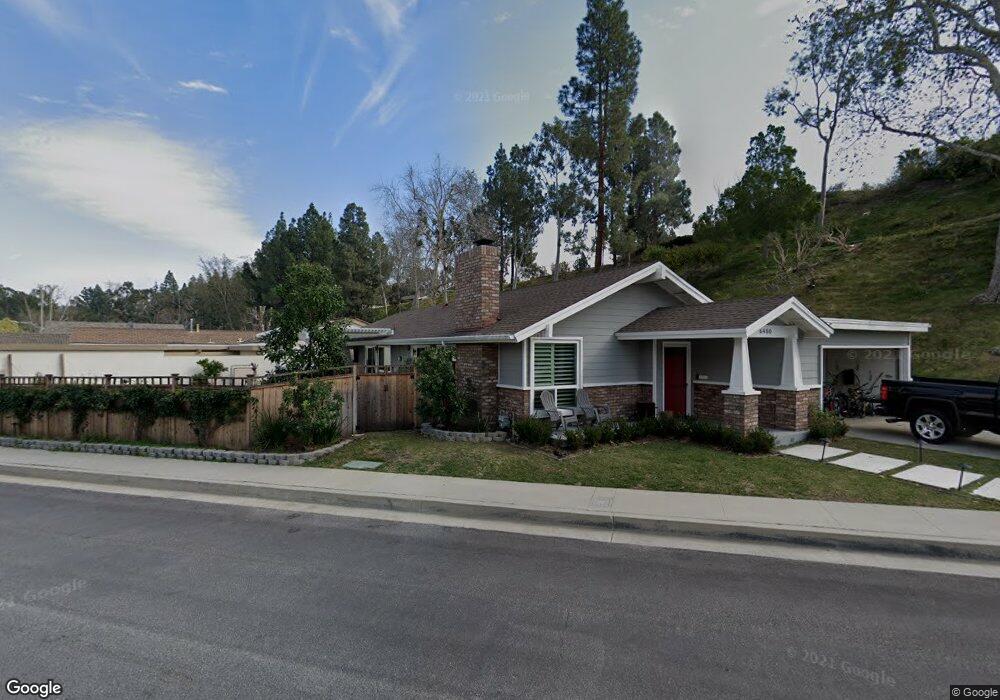
6400 E Via Arboles Anaheim, CA 92807
Anaheim Hills NeighborhoodEstimated Value: $1,174,000 - $1,602,000
3
Beds
2
Baths
2,177
Sq Ft
$626/Sq Ft
Est. Value
About This Home
This home is located at 6400 E Via Arboles, Anaheim, CA 92807 and is currently estimated at $1,362,745, approximately $625 per square foot. 6400 E Via Arboles is a home located in Orange County with nearby schools including Canyon Rim Elementary, Canyon High School, and El Rancho Charter.
Ownership History
Date
Name
Owned For
Owner Type
Purchase Details
Closed on
Oct 30, 2009
Sold by
Cha Yong Suk
Bought by
Rommelfanger Robert R and Rommelfanger Shelby M
Current Estimated Value
Home Financials for this Owner
Home Financials are based on the most recent Mortgage that was taken out on this home.
Original Mortgage
$454,008
Outstanding Balance
$296,298
Interest Rate
4.99%
Mortgage Type
FHA
Estimated Equity
$1,066,447
Purchase Details
Closed on
Jul 25, 2006
Sold by
Cha Kwang Nam and Cha Choon Ja
Bought by
Cha Yong Suk
Purchase Details
Closed on
Apr 26, 1999
Sold by
Kim Gail E Revocable Trust and Michael
Bought by
Cha Kwang Nam and Cha Choon Ja
Home Financials for this Owner
Home Financials are based on the most recent Mortgage that was taken out on this home.
Original Mortgage
$168,000
Interest Rate
6.9%
Purchase Details
Closed on
Aug 7, 1997
Sold by
Kim Gail E
Bought by
Gail E Kim Revocable Trust
Create a Home Valuation Report for This Property
The Home Valuation Report is an in-depth analysis detailing your home's value as well as a comparison with similar homes in the area
Home Values in the Area
Average Home Value in this Area
Purchase History
| Date | Buyer | Sale Price | Title Company |
|---|---|---|---|
| Rommelfanger Robert R | $485,000 | Lawyers Title Co | |
| Cha Yong Suk | -- | None Available | |
| Cha Kwang Nam | $240,000 | South Coast Title | |
| Gail E Kim Revocable Trust | -- | -- |
Source: Public Records
Mortgage History
| Date | Status | Borrower | Loan Amount |
|---|---|---|---|
| Open | Rommelfanger Robert R | $454,008 | |
| Previous Owner | Cha Kwang Nam | $168,000 |
Source: Public Records
Tax History Compared to Growth
Tax History
| Year | Tax Paid | Tax Assessment Tax Assessment Total Assessment is a certain percentage of the fair market value that is determined by local assessors to be the total taxable value of land and additions on the property. | Land | Improvement |
|---|---|---|---|---|
| 2025 | $7,780 | $712,858 | $459,234 | $253,624 |
| 2024 | $7,780 | $698,881 | $450,230 | $248,651 |
| 2023 | $7,609 | $685,178 | $441,402 | $243,776 |
| 2022 | $7,034 | $631,217 | $432,747 | $198,470 |
| 2021 | $6,838 | $618,841 | $424,262 | $194,579 |
| 2020 | $6,775 | $612,496 | $419,912 | $192,584 |
| 2019 | $6,690 | $600,487 | $411,679 | $188,808 |
| 2018 | $6,588 | $588,713 | $403,607 | $185,106 |
| 2017 | $6,314 | $577,170 | $395,693 | $181,477 |
| 2016 | $6,192 | $565,853 | $387,934 | $177,919 |
| 2015 | $5,734 | $520,904 | $382,107 | $138,797 |
| 2014 | $5,613 | $510,701 | $374,622 | $136,079 |
Source: Public Records
Map
Nearby Homes
- 536 S Circulo Lazo
- 6554 E Via Estrada
- 6587 E Via Arboles
- 397 S San Vicente Ln Unit 31
- 157 S Donna Ct
- 7583 E Country Hill Ln
- 6070 E Summit Ct Unit 48
- 770 S Stillwater Ln
- 414 S Cooks Corner
- 6577 E Camino Vista Unit 5
- 6577 E Camino Vista Unit 6
- 7350 E Calle Durango
- 752 S Stillwater Ln
- 719 S Goldfinch Way
- 562 S Covered Wagon Trail
- 5997 E Calle Principia
- 6024 E Silverspur Trail
- 5901 E Firenze Crescent
- 7653 E Corto Rd
- 242 N Camino Arroyo
- 6408 E Via Arboles
- 402 S Paseo Serena
- 6416 E Via Arboles
- 422 S Paseo Serena
- 6413 E Via Arboles
- 6415 E Via Arboles
- 6411 E Via Arboles
- 6417 E Via Arboles
- 442 S Paseo Serena
- 403 S Paseo Serena
- 6424 E Via Arboles
- 6409 E Via Arboles
- 6409 E Via Estrada
- 462 S Paseo Serena
- 6432 E Via Arboles
- 6407 E Via Arboles
- 6419 E Via Arboles
- 6425 E Via Arboles
- 6415 E Via Estrada
- 423 S Paseo Serena