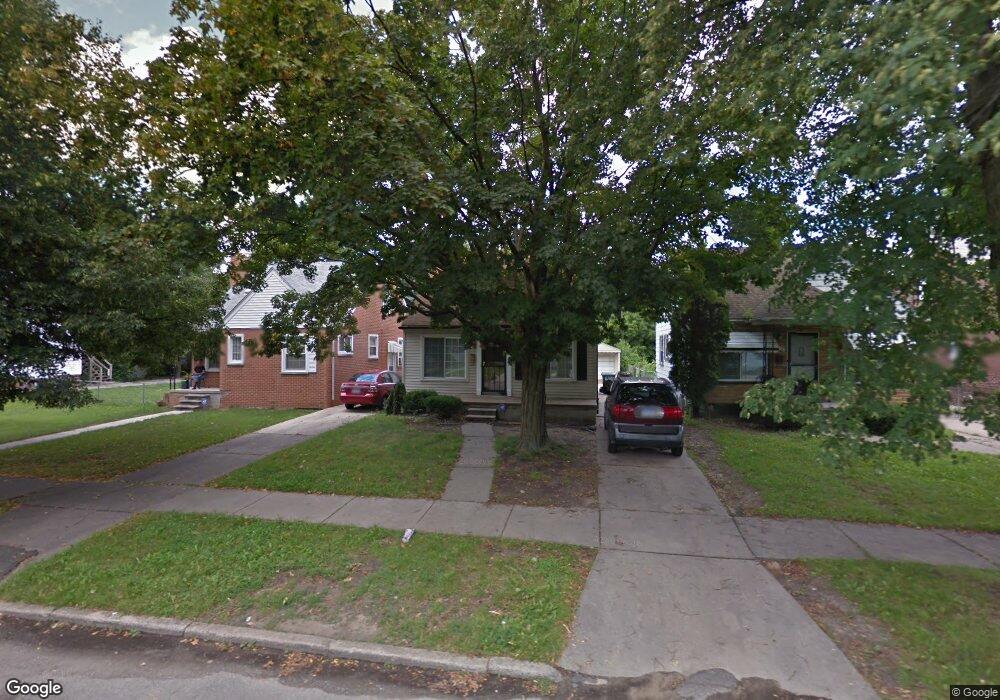
6400 Minock St Detroit, MI 48228
Warrendale NeighborhoodEstimated Value: $67,000 - $95,000
--
Bed
1
Bath
962
Sq Ft
$84/Sq Ft
Est. Value
About This Home
This home is located at 6400 Minock St, Detroit, MI 48228 and is currently estimated at $80,447, approximately $83 per square foot. 6400 Minock St is a home located in Wayne County with nearby schools including Carver STEM Academy, Charles L. Spain Elementary-Middle School, and Edward 'Duke' Ellington Conservatory of Music and Art.
Ownership History
Date
Name
Owned For
Owner Type
Purchase Details
Closed on
Oct 8, 2020
Sold by
Dya Property Llc
Bought by
Maria Property Managemant Llc
Current Estimated Value
Purchase Details
Closed on
Feb 24, 2020
Sold by
Alsamaraie Yousif
Bought by
Dya Property Llc
Purchase Details
Closed on
Oct 10, 2019
Sold by
County Of Wayne
Bought by
Dya Property Llc
Purchase Details
Closed on
Aug 1, 2017
Sold by
Minock 6400 Llc
Bought by
Fung Lok Siu
Purchase Details
Closed on
Feb 20, 2014
Sold by
Midas Development Corp
Bought by
Minock 6400 Llc
Purchase Details
Closed on
Nov 15, 2013
Sold by
Wamar Properties Llc
Bought by
Midas Development Corp
Purchase Details
Closed on
Nov 22, 2011
Sold by
Wayne County Treasurer
Bought by
Wamar Properties Llc
Purchase Details
Closed on
Oct 21, 2005
Sold by
Ostrowski Diana B
Bought by
Patton Leary Landon
Create a Home Valuation Report for This Property
The Home Valuation Report is an in-depth analysis detailing your home's value as well as a comparison with similar homes in the area
Home Values in the Area
Average Home Value in this Area
Purchase History
| Date | Buyer | Sale Price | Title Company |
|---|---|---|---|
| Maria Property Managemant Llc | $43,500 | None Available | |
| Dya Property Llc | -- | None Available | |
| Dya Property Llc | $27,100 | None Available | |
| Fung Lok Siu | -- | None Available | |
| Minock 6400 Llc | $37,000 | None Available | |
| Midas Development Corp | $323,000 | None Available | |
| Wamar Properties Llc | $2,655 | None Available | |
| Patton Leary Landon | $92,100 | Lawyers Title Ins |
Source: Public Records
Tax History Compared to Growth
Tax History
| Year | Tax Paid | Tax Assessment Tax Assessment Total Assessment is a certain percentage of the fair market value that is determined by local assessors to be the total taxable value of land and additions on the property. | Land | Improvement |
|---|---|---|---|---|
| 2025 | $1,468 | $31,200 | $0 | $0 |
| 2024 | $1,468 | $26,200 | $0 | $0 |
| 2023 | $1,426 | $20,500 | $0 | $0 |
| 2022 | $1,522 | $17,800 | $0 | $0 |
| 2021 | $1,742 | $14,200 | $0 | $0 |
| 2020 | $1,355 | $12,600 | $0 | $0 |
| 2019 | $1,164 | $11,000 | $0 | $0 |
| 2018 | $1,025 | $10,200 | $0 | $0 |
| 2017 | $197 | $10,400 | $0 | $0 |
| 2016 | $1,557 | $15,600 | $0 | $0 |
| 2015 | $1,560 | $15,600 | $0 | $0 |
| 2013 | $1,718 | $17,183 | $0 | $0 |
| 2010 | -- | $25,192 | $742 | $24,450 |
Source: Public Records
Map
Nearby Homes
- 6352 Grandville Ave
- 6367 Plainview Ave
- 6219 Westwood St
- 6352 Evergreen Ave
- 6365 Warwick St
- 6219 Plainview Ave
- 6746 Westwood St
- 6101 Auburn St
- 6733 Plainview Ave
- 6067 Minock St
- 6078 Plainview Ave
- 6717 Evergreen Ave
- 6426 Artesian St
- 6803 Plainview Ave
- 6850 Auburn St
- 6760 Warwick St
- 6816 Piedmont St
- 6816 Evergreen Ave
- 6837 Plainview Ave
- 6851 Piedmont St
- 6394 Minock St
- 6408 Minock St
- 6414 Minock St
- 6386 Minock St
- 6389 Westwood St
- 6422 Minock St
- 6380 Minock St
- 6381 Westwood St
- 6430 Minock St
- 6374 Minock St
- 6403 Westwood St
- 6409 Westwood St
- 6395 Westwood St
- 6415 Westwood St
- 6423 Westwood St
- 6368 Minock St
- 6436 Minock St
- 6403 Minock St
- 6403 Minock St
- 6395 Minock St