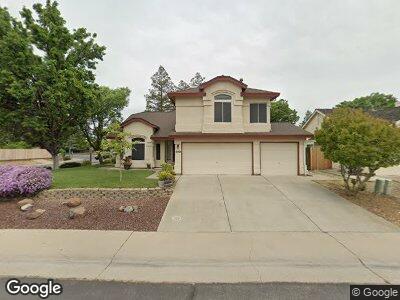
6401 Alpinespring Way Elk Grove, CA 95758
North West Elk Grove NeighborhoodEstimated Value: $567,000 - $617,000
4
Beds
3
Baths
2,059
Sq Ft
$289/Sq Ft
Est. Value
About This Home
This home is located at 6401 Alpinespring Way, Elk Grove, CA 95758 and is currently estimated at $595,052, approximately $289 per square foot. 6401 Alpinespring Way is a home located in Sacramento County with nearby schools including John Ehrhardt Elementary School, Harriet G. Eddy Middle School, and Laguna Creek High School.
Ownership History
Date
Name
Owned For
Owner Type
Purchase Details
Closed on
May 1, 2008
Sold by
Us Bank Na
Bought by
Lau Jose B and Lau Miria R
Current Estimated Value
Home Financials for this Owner
Home Financials are based on the most recent Mortgage that was taken out on this home.
Original Mortgage
$238,500
Interest Rate
5.8%
Mortgage Type
Purchase Money Mortgage
Purchase Details
Closed on
Jul 23, 2007
Sold by
Singh Frederick
Bought by
Us Bank Na and Bear Stearns Asset Backed Securities 1 T
Purchase Details
Closed on
Dec 30, 2005
Sold by
Rouse Norene I and Diede Dennis G
Bought by
Singh Frederick
Home Financials for this Owner
Home Financials are based on the most recent Mortgage that was taken out on this home.
Original Mortgage
$396,000
Interest Rate
6.87%
Mortgage Type
Fannie Mae Freddie Mac
Create a Home Valuation Report for This Property
The Home Valuation Report is an in-depth analysis detailing your home's value as well as a comparison with similar homes in the area
Home Values in the Area
Average Home Value in this Area
Purchase History
| Date | Buyer | Sale Price | Title Company |
|---|---|---|---|
| Lau Jose B | $265,000 | First American Title Company | |
| Us Bank Na | $395,000 | Accommodation | |
| Singh Frederick | $495,000 | North American Title Company |
Source: Public Records
Mortgage History
| Date | Status | Borrower | Loan Amount |
|---|---|---|---|
| Open | Lau Jose | $197,380 | |
| Closed | Lau Jose B | $230,000 | |
| Closed | Lau Jose B | $238,500 | |
| Previous Owner | Singh Frederick | $396,000 | |
| Previous Owner | Diede Dennis G | $35,000 |
Source: Public Records
Tax History Compared to Growth
Tax History
| Year | Tax Paid | Tax Assessment Tax Assessment Total Assessment is a certain percentage of the fair market value that is determined by local assessors to be the total taxable value of land and additions on the property. | Land | Improvement |
|---|---|---|---|---|
| 2024 | $4,112 | $341,242 | $135,209 | $206,033 |
| 2023 | $3,999 | $334,552 | $132,558 | $201,994 |
| 2022 | $3,933 | $327,993 | $129,959 | $198,034 |
| 2021 | $3,860 | $321,562 | $127,411 | $194,151 |
| 2020 | $3,804 | $318,266 | $126,105 | $192,161 |
| 2019 | $3,731 | $312,027 | $123,633 | $188,394 |
| 2018 | $3,631 | $305,909 | $121,209 | $184,700 |
| 2017 | $3,561 | $299,912 | $118,833 | $181,079 |
| 2016 | $3,396 | $294,032 | $116,503 | $177,529 |
| 2015 | $3,329 | $289,617 | $114,754 | $174,863 |
| 2014 | $3,283 | $283,945 | $112,507 | $171,438 |
Source: Public Records
Map
Nearby Homes
- 9005 Old Creek Dr
- 6009 Villa Rosa Way
- 9034 Acorn Ridge Cir
- 8856 Westside Way
- 6813 Springridge Way
- 8825 Kepler Ct
- 8935 Cypress View Way
- 6512 Canyon Creek Way
- 6501 di Lusso Dr
- 6425 Laguna Mirage Ln
- 7001 Tiant Way
- 5528 Deepdale Way
- 6721 Paseo Del Sol Way
- 9004 Beryl Creek Way
- 5836 Laguna Shore Way
- 9255 Guillermina Ct
- 5126 Pleasantglen Way
- 8687 Bluefield Way
- 7213 Tiant Way
- 9105 Turnbull Ct
- 6401 Alpinespring Way
- 6405 Alpinespring Way
- 6409 Alpinespring Way
- 9000 Meadowspring Dr
- 6325 Alpinespring Way
- 6404 Alpinespring Way
- 6413 Alpinespring Way
- 8996 Meadowspring Dr
- 6408 Alpinespring Way
- 6321 Alpinespring Way
- 6324 Alpinespring Way
- 9055 Paso Robles Way
- 6503 Dunedin Place
- 8992 Meadowspring Dr
- 6320 Alpinespring Way
- 6317 Alpinespring Way
- 6400 Silver Hawk Way
- 6404 Silver Hawk Way
- 6500 Dunedin Place
- 9049 Paso Robles Way