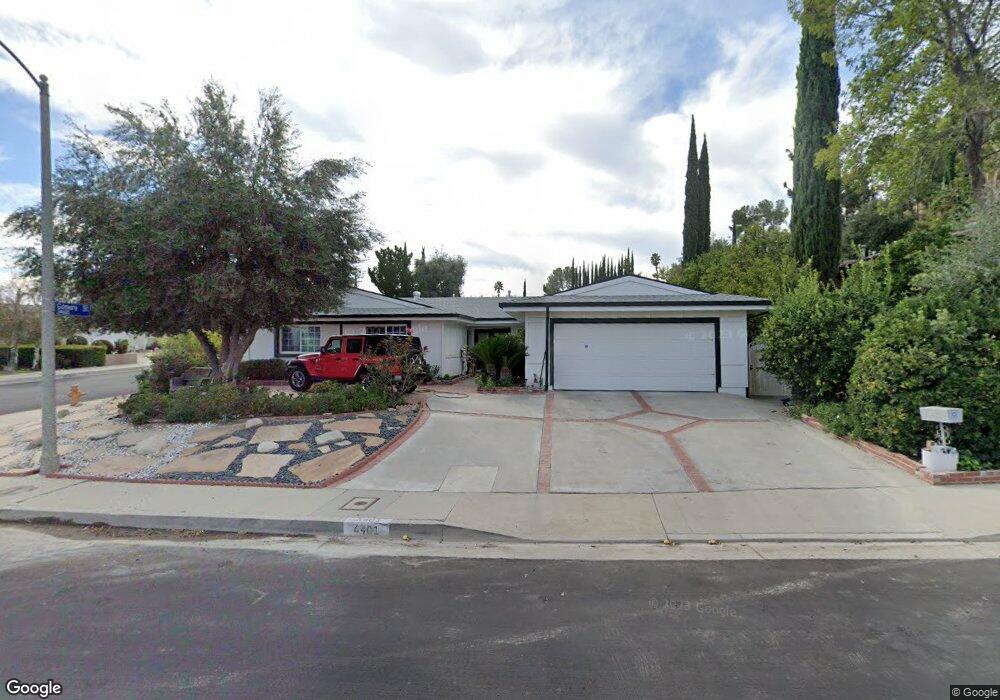
6401 Antigua Place West Hills, CA 91307
Estimated Value: $1,248,000 - $1,544,000
4
Beds
3
Baths
2,315
Sq Ft
$578/Sq Ft
Est. Value
About This Home
This home is located at 6401 Antigua Place, West Hills, CA 91307 and is currently estimated at $1,337,476, approximately $577 per square foot. 6401 Antigua Place is a home located in Los Angeles County with nearby schools including Haynes Charter For Enriched Studies, Lockhurst Drive Charter Elementary, and Woodlake Elementary Community Charter.
Ownership History
Date
Name
Owned For
Owner Type
Purchase Details
Closed on
Jun 13, 2005
Sold by
Neyssani Ebrahim and Neyssani Akram
Bought by
Neyssani Ebrahim
Current Estimated Value
Home Financials for this Owner
Home Financials are based on the most recent Mortgage that was taken out on this home.
Original Mortgage
$375,000
Outstanding Balance
$194,005
Interest Rate
5.62%
Mortgage Type
Purchase Money Mortgage
Estimated Equity
$1,143,471
Purchase Details
Closed on
Mar 18, 1994
Sold by
Moline Raymond P and Moline Judie J
Bought by
Neyssani Abrahim
Home Financials for this Owner
Home Financials are based on the most recent Mortgage that was taken out on this home.
Original Mortgage
$216,000
Interest Rate
7.84%
Purchase Details
Closed on
Sep 14, 1993
Sold by
Mtc Financial Inc
Bought by
Moline Raymond P
Create a Home Valuation Report for This Property
The Home Valuation Report is an in-depth analysis detailing your home's value as well as a comparison with similar homes in the area
Home Values in the Area
Average Home Value in this Area
Purchase History
| Date | Buyer | Sale Price | Title Company |
|---|---|---|---|
| Neyssani Ebrahim | -- | -- | |
| Neyssani Abrahim | $240,000 | Southland Title Corporation | |
| Moline Raymond P | $127,637 | -- |
Source: Public Records
Mortgage History
| Date | Status | Borrower | Loan Amount |
|---|---|---|---|
| Open | Neyssani Ebrahim | $375,000 | |
| Previous Owner | Neyssani Abrahim | $216,000 |
Source: Public Records
Tax History Compared to Growth
Tax History
| Year | Tax Paid | Tax Assessment Tax Assessment Total Assessment is a certain percentage of the fair market value that is determined by local assessors to be the total taxable value of land and additions on the property. | Land | Improvement |
|---|---|---|---|---|
| 2025 | $5,260 | $407,896 | $258,511 | $149,385 |
| 2024 | $5,260 | $399,899 | $253,443 | $146,456 |
| 2023 | $5,165 | $392,059 | $248,474 | $143,585 |
| 2022 | $13,027 | $384,372 | $243,602 | $140,770 |
| 2021 | $12,958 | $376,836 | $238,826 | $138,010 |
| 2019 | $12,819 | $365,661 | $231,744 | $133,917 |
| 2018 | $12,659 | $358,492 | $227,200 | $131,292 |
| 2016 | $4,350 | $344,574 | $218,379 | $126,195 |
| 2015 | $4,289 | $339,399 | $215,099 | $124,300 |
| 2014 | $4,311 | $332,752 | $210,886 | $121,866 |
Source: Public Records
Map
Nearby Homes
- 24686 Wooded Vista
- 6171 Jared Ct
- 24784 Wooded Vista
- 24630 Kittridge St
- 24415 Lemay St
- 5985 Vista de la Luz
- 6032 County Oak Rd
- 5960 Pat Ave
- 24926 Vista Verenda
- 24417 Clipstone St
- 24244 Friar St
- 24221 Aetna St
- 24208 Gilmore St
- 5910 Pat Ave
- 24101 Mobile St
- 6009 Neddy Ave
- 24153 Califa St
- 24017 Sylvan St
- 24300 Clipstone St
- 5931 Neddy Ave
- 6411 Antigua Place
- 24615 Gilmore St
- 24592 Gilmore St
- 6421 Antigua Place
- 24600 Gilmore St
- 6400 Antigua Place
- 24625 Gilmore St
- 24584 Gilmore St
- 6412 Antigua Place
- 24612 Gilmore St
- 6429 Antigua Place
- 24574 Gilmore St
- 6420 Antigua Place
- 24620 Gilmore St
- 24633 Gilmore St
- 6426 Antigua Place
- 6421 Dunlo Place
- 6319 Ellenview Ave
- 6311 Ellenview Ave
- 24564 Gilmore St