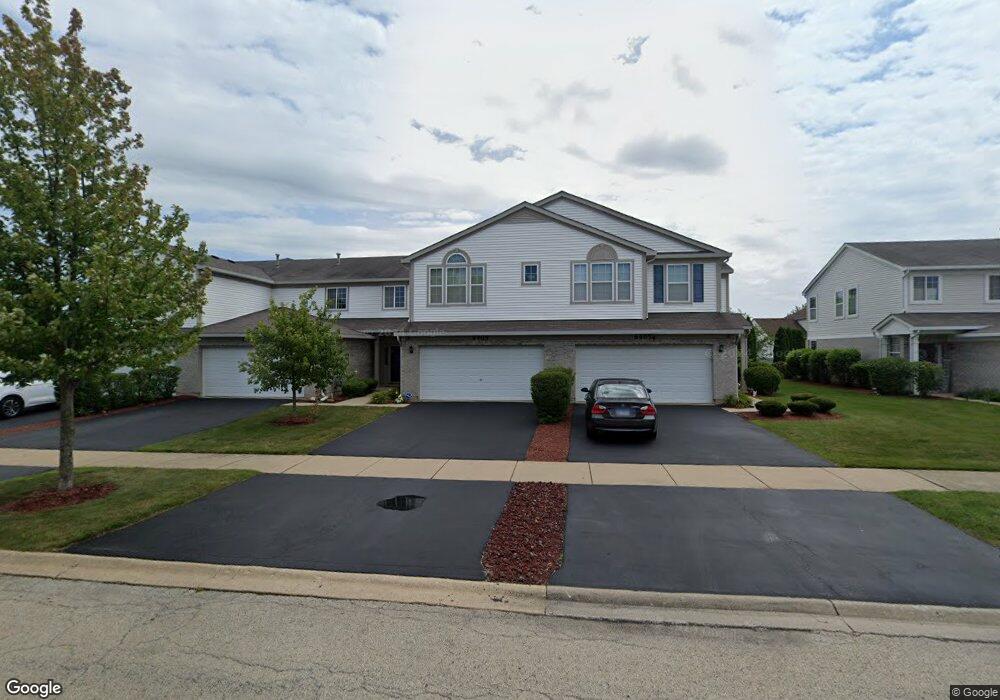
6405 Blue Sky Ln Unit 2533 Matteson, IL 60443
West Matteson NeighborhoodEstimated Value: $250,000 - $274,000
2
Beds
3
Baths
212,774
Sq Ft
$1/Sq Ft
Est. Value
About This Home
This home is located at 6405 Blue Sky Ln Unit 2533, Matteson, IL 60443 and is currently estimated at $259,136, approximately $1 per square foot. 6405 Blue Sky Ln Unit 2533 is a home located in Cook County with nearby schools including Colin Powell Middle School.
Ownership History
Date
Name
Owned For
Owner Type
Purchase Details
Closed on
Feb 3, 2011
Sold by
Fannie Mae
Bought by
Wheat Niesha D
Current Estimated Value
Home Financials for this Owner
Home Financials are based on the most recent Mortgage that was taken out on this home.
Original Mortgage
$89,137
Interest Rate
4.99%
Mortgage Type
FHA
Purchase Details
Closed on
Oct 14, 2010
Sold by
Bean
Bought by
Federal National Mortgage Association
Purchase Details
Closed on
Nov 10, 2006
Sold by
Montalbano Builders Inc
Bought by
Bean Kim E
Home Financials for this Owner
Home Financials are based on the most recent Mortgage that was taken out on this home.
Original Mortgage
$222,914
Interest Rate
6.36%
Mortgage Type
Unknown
Create a Home Valuation Report for This Property
The Home Valuation Report is an in-depth analysis detailing your home's value as well as a comparison with similar homes in the area
Home Values in the Area
Average Home Value in this Area
Purchase History
| Date | Buyer | Sale Price | Title Company |
|---|---|---|---|
| Wheat Niesha D | $93,000 | Git | |
| Federal National Mortgage Association | -- | None Available | |
| Bean Kim E | $223,000 | Cti |
Source: Public Records
Mortgage History
| Date | Status | Borrower | Loan Amount |
|---|---|---|---|
| Previous Owner | Wheat Niesha D | $89,137 | |
| Previous Owner | Bean Kim E | $222,914 |
Source: Public Records
Tax History Compared to Growth
Tax History
| Year | Tax Paid | Tax Assessment Tax Assessment Total Assessment is a certain percentage of the fair market value that is determined by local assessors to be the total taxable value of land and additions on the property. | Land | Improvement |
|---|---|---|---|---|
| 2024 | $6,824 | $19,779 | $5,081 | $14,698 |
| 2023 | $4,903 | $19,779 | $5,081 | $14,698 |
| 2022 | $4,903 | $12,578 | $1,594 | $10,984 |
| 2021 | $4,997 | $12,577 | $1,593 | $10,984 |
| 2020 | $4,948 | $12,577 | $1,593 | $10,984 |
| 2019 | $3,723 | $10,244 | $1,494 | $8,750 |
| 2018 | $3,666 | $10,244 | $1,494 | $8,750 |
| 2017 | $4,040 | $11,092 | $1,494 | $9,598 |
| 2016 | $2,850 | $8,005 | $1,394 | $6,611 |
| 2015 | $3,075 | $8,675 | $1,394 | $7,281 |
| 2014 | $3,019 | $8,675 | $1,394 | $7,281 |
| 2013 | $4,023 | $11,375 | $1,394 | $9,981 |
Source: Public Records
Map
Nearby Homes
- 21143 Gray Hawk Dr Unit 2554
- 6423 Gray Hawk Dr Unit 2716
- 6529 Blue Sky Ln
- 6520 Bridle Path Dr
- 6409 Old Plank Blvd
- 0 Ridgeland Ave
- 21218 Shannon Ave
- 6608 Pasture Side Trail
- 6508 Fawn Ct
- 6700 Old Plank Blvd
- 126 Knollwood Cir
- 66 Candlegate Cir
- 123 Knollwood Cir
- 62 Brushwood Dr
- 51 Brushwood Dr
- 52 Crocus Ln
- 6216 Pond View Dr
- 1008 Willow Rd
- 25 Hearthside Dr
- 65 Crocus Ln
- 6407 Blue Sky Ln Unit 2534
- 6403 Blue Sky Ln Unit 2532
- 6401 Blue Sky Ln Unit 2531
- 6401 Blue Sky Ln Unit 1
- 6313 Blue Sky Ln Unit 2
- 6409 Blue Sky Ln Unit 2521
- 6411 Blue Sky Ln Unit 2522
- 6408 Bridle Path Dr
- 6404 Bridle Path Dr
- 6413 Blue Sky Ln Unit 2523
- 6413 Blue Sky Ln Unit 3
- 6415 Blue Sky Ln Unit 2524
- 6412 Bridle Path Dr
- 6402 Blue Sky Ln Unit 2605
- 6404 Blue Sky Ln Unit 2604
- 6404 Blue Sky Ln Unit 2
- 6406 Blue Sky Ln
- 6406 Blue Sky Ln Unit 2603
- 6400 Blue Sky Ln Unit 2606
- 6400 Blue Sky Ln Unit 4