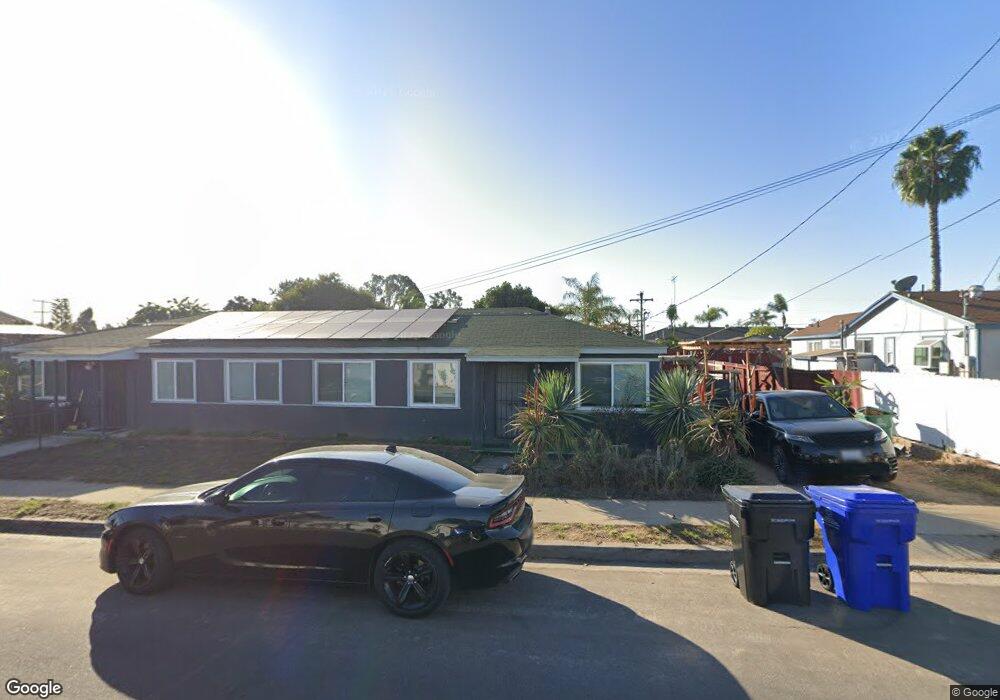
6405 Osler St Unit 7 San Diego, CA 92111
Linda Vista NeighborhoodEstimated Value: $1,176,000 - $1,501,376
7
Beds
2
Baths
2,272
Sq Ft
$596/Sq Ft
Est. Value
About This Home
This home is located at 6405 Osler St Unit 7, San Diego, CA 92111 and is currently estimated at $1,353,094, approximately $595 per square foot. 6405 Osler St Unit 7 is a home located in San Diego County with nearby schools including Linda Vista Elementary School, Montgomery Middle School, and San Diego Cooperative Charter School.
Ownership History
Date
Name
Owned For
Owner Type
Purchase Details
Closed on
Jun 27, 2019
Sold by
Caccam Jamease N and Caccam Jamease Howard
Bought by
Caccam Jamease N and Caccam Glenn Derrick Q
Current Estimated Value
Home Financials for this Owner
Home Financials are based on the most recent Mortgage that was taken out on this home.
Original Mortgage
$390,000
Outstanding Balance
$342,929
Interest Rate
4%
Mortgage Type
New Conventional
Estimated Equity
$1,010,165
Purchase Details
Closed on
May 30, 2019
Sold by
Trafton Deborah and Estate Of Exie Howard
Bought by
Caccam Jamease Howard
Home Financials for this Owner
Home Financials are based on the most recent Mortgage that was taken out on this home.
Original Mortgage
$390,000
Outstanding Balance
$342,929
Interest Rate
4%
Mortgage Type
New Conventional
Estimated Equity
$1,010,165
Purchase Details
Closed on
Feb 11, 1998
Sold by
Exie Howard
Bought by
Howard Exie and Howard Claudell L
Purchase Details
Closed on
Mar 7, 1994
Sold by
Howard Exie
Bought by
Howard Exie
Create a Home Valuation Report for This Property
The Home Valuation Report is an in-depth analysis detailing your home's value as well as a comparison with similar homes in the area
Home Values in the Area
Average Home Value in this Area
Purchase History
| Date | Buyer | Sale Price | Title Company |
|---|---|---|---|
| Caccam Jamease N | -- | Fidelity National Title Co | |
| Caccam Jamease Howard | -- | None Available | |
| Howard Exie | -- | -- | |
| Howard Exie | -- | -- |
Source: Public Records
Mortgage History
| Date | Status | Borrower | Loan Amount |
|---|---|---|---|
| Open | Caccam Jamease N | $390,000 |
Source: Public Records
Tax History Compared to Growth
Tax History
| Year | Tax Paid | Tax Assessment Tax Assessment Total Assessment is a certain percentage of the fair market value that is determined by local assessors to be the total taxable value of land and additions on the property. | Land | Improvement |
|---|---|---|---|---|
| 2025 | $12,329 | $1,024,040 | $853,369 | $170,671 |
| 2024 | $12,329 | $1,003,962 | $836,637 | $167,325 |
| 2023 | $12,057 | $984,278 | $820,233 | $164,045 |
| 2022 | $11,733 | $964,979 | $804,150 | $160,829 |
| 2021 | $11,646 | $946,059 | $788,383 | $157,676 |
| 2020 | $11,499 | $936,360 | $780,300 | $156,060 |
| 2019 | $782 | $58,148 | $21,925 | $36,223 |
| 2018 | $653 | $57,009 | $21,496 | $35,513 |
| 2017 | $80 | $55,892 | $21,075 | $34,817 |
| 2016 | $618 | $54,797 | $20,662 | $34,135 |
| 2015 | $608 | $53,975 | $20,352 | $33,623 |
| 2014 | $599 | $52,919 | $19,954 | $32,965 |
Source: Public Records
Map
Nearby Homes
- 6328-30 Quillan St
- 2525 Inman Ct
- 2750 Wheatstone St Unit 113
- 2750 Wheatstone St Unit 105
- 2750 Wheatstone St Unit 89
- 2750 Wheatstone St Unit 64
- 2818 Nye St
- 2868-70 Preece St
- 2675 Comstock St
- 6492 Lanston St
- 6728 Thomson Ct
- 6737 Thomson Ct
- 5360 Burford St
- 3161 Mount Tami Dr
- 2585 Cowley Way
- 3116 Old Kettle Rd
- 3173 Via Arcilla
- 2711 Deerpark Dr
- 6909 Park Mesa Way Unit 131
- 2802 Cowley Way
- 6381 Osler St
- 6415 Osler St Unit 17
- 6408 Quillan St Unit 10
- 6388 Quillan St Unit 90
- 6404 Osler St
- 6371 Osler St
- 6420 Quillan St Unit 22
- 6380 Osler St
- 6414 Osler St Unit 16
- 6425 Osler St Unit 27
- 6378 Quillan St Unit 80
- 6376 Osler St
- 6430 Quillan St Unit 32
- 6424 Osler St Unit 26
- 6355 Osler St Unit 57
- 6403 Quillan St Unit 5
- 6364 Osler St
- 6421 Quillan St
- 6435 Osler St
- 6368 Quillan St