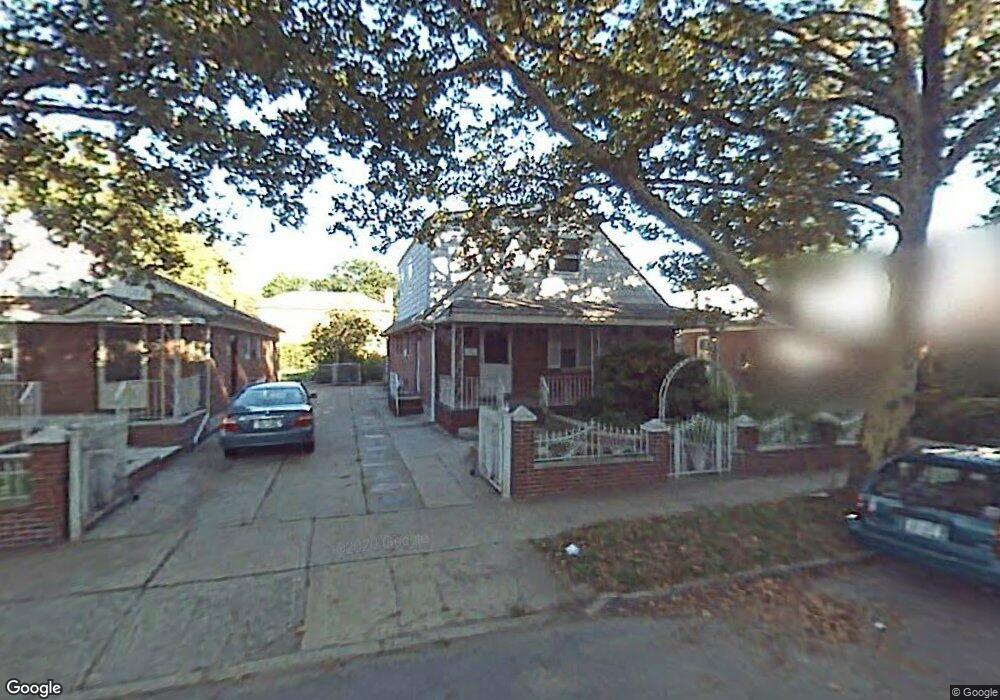
6407 175th St Fresh Meadows, NY 11365
Fresh Meadows NeighborhoodEstimated Value: $1,184,903 - $1,475,000
Studio
--
Bath
1,774
Sq Ft
$773/Sq Ft
Est. Value
About This Home
This home is located at 6407 175th St, Fresh Meadows, NY 11365 and is currently estimated at $1,370,476, approximately $772 per square foot. 6407 175th St is a home located in Queens County with nearby schools including P.S. 173 - Fresh Meadow, George J. Ryan Middle School 216, and Francis Lewis High School.
Ownership History
Date
Name
Owned For
Owner Type
Purchase Details
Closed on
Aug 31, 2015
Sold by
Chen Xiu and Zhang Wen Luan
Bought by
Chen Xiu
Current Estimated Value
Purchase Details
Closed on
Mar 13, 2009
Sold by
Karamitros Dimitrios and Konstantakopoulos Odisseas
Bought by
Chen Xiu and Zhang Wen Luan
Home Financials for this Owner
Home Financials are based on the most recent Mortgage that was taken out on this home.
Original Mortgage
$375,000
Interest Rate
4.92%
Mortgage Type
Commercial
Purchase Details
Closed on
Dec 4, 2007
Sold by
Maltz Esq Judah
Bought by
Karamitros Dimitrios and Konstantakopoulos Odisseas
Purchase Details
Closed on
Jun 21, 2005
Sold by
Mignanelli Giuseppina and Mignanelli Rocco
Bought by
Chan Henry
Home Financials for this Owner
Home Financials are based on the most recent Mortgage that was taken out on this home.
Original Mortgage
$70,000
Interest Rate
5.71%
Create a Home Valuation Report for This Property
The Home Valuation Report is an in-depth analysis detailing your home's value as well as a comparison with similar homes in the area
Home Values in the Area
Average Home Value in this Area
Purchase History
| Date | Buyer | Sale Price | Title Company |
|---|---|---|---|
| Chen Xiu | -- | -- | |
| Chen Xiu | -- | -- | |
| Chen Xiu | $675,000 | -- | |
| Chen Xiu | $675,000 | -- | |
| Karamitros Dimitrios | $600,000 | -- | |
| Karamitros Dimitrios | $600,000 | -- | |
| Chan Henry | $700,000 | -- | |
| Chan Henry | $700,000 | -- |
Source: Public Records
Mortgage History
| Date | Status | Borrower | Loan Amount |
|---|---|---|---|
| Previous Owner | Chen Xiu | $375,000 | |
| Previous Owner | Chan Henry | $70,000 | |
| Previous Owner | Chan Henry | $560,000 |
Source: Public Records
Tax History
| Year | Tax Paid | Tax Assessment Tax Assessment Total Assessment is a certain percentage of the fair market value that is determined by local assessors to be the total taxable value of land and additions on the property. | Land | Improvement |
|---|---|---|---|---|
| 2025 | $11,679 | $59,719 | $16,106 | $43,613 |
| 2024 | $11,679 | $58,150 | $14,726 | $43,424 |
| 2023 | $11,018 | $54,859 | $15,127 | $39,732 |
| 2022 | $10,332 | $69,960 | $19,920 | $50,040 |
| 2021 | $10,892 | $67,800 | $19,920 | $47,880 |
| 2020 | $10,534 | $64,200 | $19,920 | $44,280 |
| 2019 | $10,137 | $64,620 | $19,920 | $44,700 |
| 2018 | $9,319 | $45,716 | $14,441 | $31,275 |
| 2017 | $8,792 | $43,130 | $15,718 | $27,412 |
| 2016 | $8,622 | $43,130 | $15,718 | $27,412 |
| 2015 | $4,907 | $41,472 | $20,030 | $21,442 |
| 2014 | $4,907 | $40,382 | $19,327 | $21,055 |
Source: Public Records
Map
Nearby Homes
- 64-04 Utopia Pkwy
- 17508 65th Ave
- 61-31 182nd St
- 17211 Horace Harding Expy
- 67-07 Fresh Meadow Ln
- 65-15 183rd St
- 6139 184th St
- 183-26 Booth Memorial Ave
- 182-15 58th Ave Unit A
- 56-49A Utopia Pkwy
- 6532 170th St
- 6537 169th St
- 5052 Utopia Pkwy
- 183-19 69th Ave
- 61-38 167th St
- 6961 180th St
- 65-26 167th St
- 49-75 175th Place
- 6123 165th St
- 70-07 171st St
Your Personal Tour Guide
Ask me questions while you tour the home.