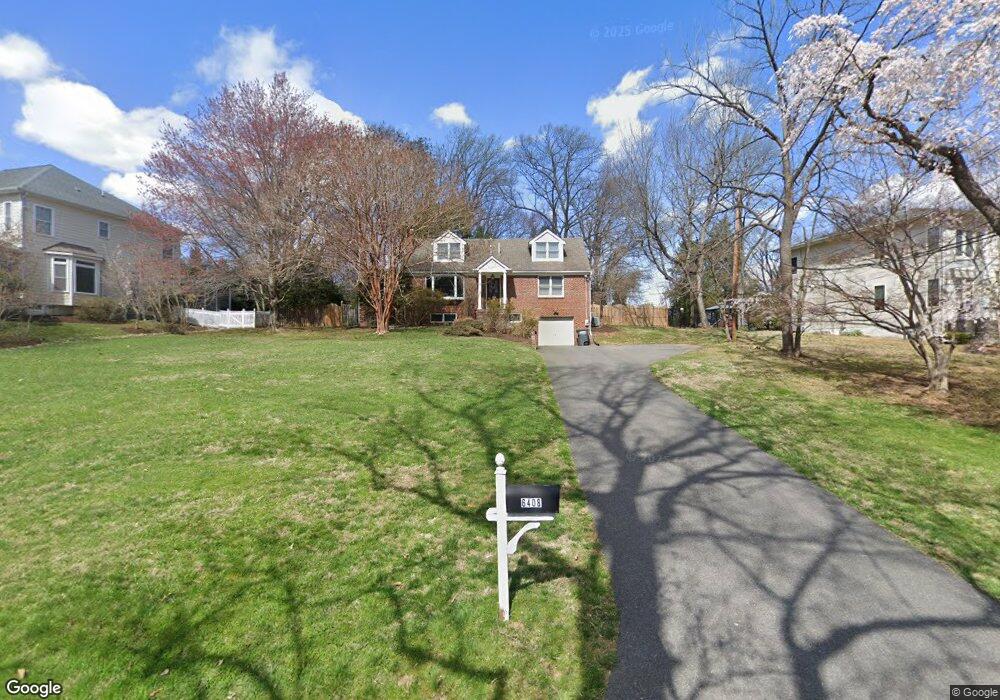
6408 Divine St McLean, VA 22101
Estimated Value: $1,388,000 - $1,531,000
4
Beds
3
Baths
1,996
Sq Ft
$726/Sq Ft
Est. Value
About This Home
This home is located at 6408 Divine St, McLean, VA 22101 and is currently estimated at $1,448,880, approximately $725 per square foot. 6408 Divine St is a home located in Fairfax County with nearby schools including Chesterbrook Elementary School, Longfellow Middle School, and Saint John the Beloved Academy.
Ownership History
Date
Name
Owned For
Owner Type
Purchase Details
Closed on
Oct 31, 1997
Sold by
Thorne Eric and Thorne Christine
Bought by
Wood Paul R and Wood Angela K
Current Estimated Value
Home Financials for this Owner
Home Financials are based on the most recent Mortgage that was taken out on this home.
Original Mortgage
$231,960
Outstanding Balance
$38,169
Interest Rate
7.31%
Mortgage Type
New Conventional
Estimated Equity
$1,410,711
Purchase Details
Closed on
Feb 12, 1997
Sold by
Knutsen Brian E and Knutsen Martha J Mcinnis
Bought by
Thorne Eric and Thorne Christine
Home Financials for this Owner
Home Financials are based on the most recent Mortgage that was taken out on this home.
Original Mortgage
$267,900
Interest Rate
7.6%
Mortgage Type
New Conventional
Purchase Details
Closed on
Mar 24, 1994
Sold by
Sippley E Y
Bought by
Mcinnis Martha J
Home Financials for this Owner
Home Financials are based on the most recent Mortgage that was taken out on this home.
Original Mortgage
$234,000
Interest Rate
7.15%
Mortgage Type
Purchase Money Mortgage
Create a Home Valuation Report for This Property
The Home Valuation Report is an in-depth analysis detailing your home's value as well as a comparison with similar homes in the area
Home Values in the Area
Average Home Value in this Area
Purchase History
| Date | Buyer | Sale Price | Title Company |
|---|---|---|---|
| Wood Paul R | $289,950 | -- | |
| Thorne Eric | $282,000 | -- | |
| Mcinnis Martha J | $260,000 | -- |
Source: Public Records
Mortgage History
| Date | Status | Borrower | Loan Amount |
|---|---|---|---|
| Open | Mcinnis Martha J | $231,960 | |
| Previous Owner | Mcinnis Martha J | $267,900 | |
| Previous Owner | Mcinnis Martha J | $234,000 |
Source: Public Records
Tax History Compared to Growth
Tax History
| Year | Tax Paid | Tax Assessment Tax Assessment Total Assessment is a certain percentage of the fair market value that is determined by local assessors to be the total taxable value of land and additions on the property. | Land | Improvement |
|---|---|---|---|---|
| 2025 | $14,166 | $1,259,200 | $608,000 | $651,200 |
| 2024 | $14,166 | $1,199,000 | $581,000 | $618,000 |
| 2023 | $12,478 | $1,083,600 | $534,000 | $549,600 |
| 2022 | $11,815 | $1,012,830 | $471,000 | $541,830 |
| 2021 | $10,547 | $881,520 | $444,000 | $437,520 |
| 2020 | $10,534 | $873,140 | $431,000 | $442,140 |
| 2019 | $10,286 | $852,570 | $423,000 | $429,570 |
| 2018 | $9,805 | $852,570 | $423,000 | $429,570 |
| 2017 | $9,936 | $839,200 | $423,000 | $416,200 |
| 2016 | $9,535 | $807,040 | $399,000 | $408,040 |
| 2015 | $9,057 | $795,160 | $399,000 | $396,160 |
| 2014 | $8,239 | $724,940 | $376,000 | $348,940 |
Source: Public Records
Map
Nearby Homes
- 6424 Divine St
- 6434 Noble Dr
- 1730 Barbee St
- 6330 Cross St
- 6514 Byrnes Dr
- 1705 East Ave
- 6529 Fairlawn Dr
- 6304 Old Dominion Dr
- 6511 Ivy Hill Dr
- 6603 Byrnes Dr
- 1712 Dalewood Place
- 1710 Dalewood Place
- 1904 Lamson Place
- 1843 Rhode Island Ave
- 1623 Dempsey St
- 1616 6th Place
- 1616 6th Lot D and C Place
- 1650 Kirby Rd
- 6238 Linway Terrace
- 6613 Chesterfield Ave
- 6412 Divine St
- 1714 Esquire Ln
- 6348 Divine St
- 6416 Divine St
- 6405 Old Chesterbrook Rd
- 6409 Divine St
- 1712 Esquire Ln
- 6420 Divine St
- 6413 Divine St
- 6401 Old Chesterbrook Rd
- 6340 Divine St
- 6417 Divine St
- 6405 Divine St
- 1715 Esquire Ln
- 1710 Esquire Ln
- 6401 Divine St
- 6347 Divine St
- 6421 Divine St
- 1713 Esquire Ln
- 6343 Divine St