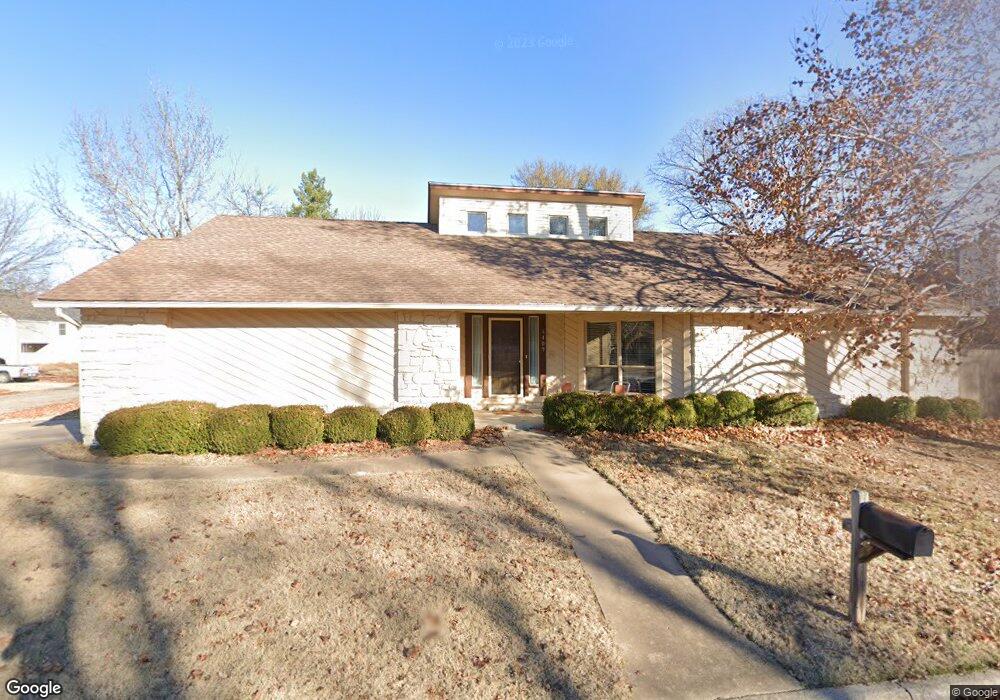
6409 E 94th Place Tulsa, OK 74137
Brookwood NeighborhoodEstimated Value: $244,809 - $270,000
3
Beds
2
Baths
1,704
Sq Ft
$151/Sq Ft
Est. Value
About This Home
This home is located at 6409 E 94th Place, Tulsa, OK 74137 and is currently estimated at $257,952, approximately $151 per square foot. 6409 E 94th Place is a home located in Tulsa County with nearby schools including Jenks East Elementary School, Jenks East Intermediate Elementary School, and Jenks Middle School.
Ownership History
Date
Name
Owned For
Owner Type
Purchase Details
Closed on
Dec 30, 2005
Sold by
Namy Nasim F
Bought by
Namy Nasim F and Namy Mark Paul
Current Estimated Value
Purchase Details
Closed on
Oct 3, 2005
Sold by
Rude Sun and Brestel Herbert
Bought by
Namy Nasim F
Home Financials for this Owner
Home Financials are based on the most recent Mortgage that was taken out on this home.
Original Mortgage
$100,000
Interest Rate
5.65%
Mortgage Type
Fannie Mae Freddie Mac
Purchase Details
Closed on
Dec 16, 2002
Sold by
Rude Candy Deann
Bought by
Rude In Sun
Purchase Details
Closed on
Feb 22, 2001
Sold by
Rude In Sun
Bought by
Rude Candy Deann
Purchase Details
Closed on
Apr 23, 1999
Sold by
Rude Candy Deann
Bought by
Rude In Sun
Purchase Details
Closed on
Mar 31, 1999
Sold by
Buthod Therese and Rude Candy Deann
Bought by
Rude Candy Deann
Purchase Details
Closed on
Feb 16, 1998
Sold by
Rude Insun and Brestel Herbert
Bought by
Therese Rude Candy Deann and Therese Buthol
Create a Home Valuation Report for This Property
The Home Valuation Report is an in-depth analysis detailing your home's value as well as a comparison with similar homes in the area
Home Values in the Area
Average Home Value in this Area
Purchase History
| Date | Buyer | Sale Price | Title Company |
|---|---|---|---|
| Namy Nasim F | -- | First Amer Title & Abstract | |
| Namy Nasim F | $125,000 | First American Title & Abstr | |
| Rude In Sun | -- | -- | |
| Rude Candy Deann | -- | -- | |
| Rude In Sun | -- | -- | |
| Rude Candy Deann | -- | -- | |
| Therese Rude Candy Deann | -- | -- |
Source: Public Records
Mortgage History
| Date | Status | Borrower | Loan Amount |
|---|---|---|---|
| Closed | Namy Nasim F | $100,000 |
Source: Public Records
Tax History
| Year | Tax Paid | Tax Assessment Tax Assessment Total Assessment is a certain percentage of the fair market value that is determined by local assessors to be the total taxable value of land and additions on the property. | Land | Improvement |
|---|---|---|---|---|
| 2025 | $2,731 | $19,315 | $3,092 | $16,223 |
| 2024 | $2,332 | $18,395 | $2,995 | $15,400 |
| 2023 | $2,332 | $17,519 | $3,020 | $14,499 |
| 2022 | $2,291 | $16,685 | $3,901 | $12,784 |
| 2021 | $2,212 | $15,890 | $3,715 | $12,175 |
| 2020 | $2,122 | $15,576 | $3,642 | $11,934 |
| 2019 | $2,090 | $14,834 | $3,468 | $11,366 |
| 2018 | $2,088 | $14,834 | $3,468 | $11,366 |
| 2017 | $1,985 | $14,437 | $3,375 | $11,062 |
| 2016 | $1,898 | $13,750 | $3,322 | $10,428 |
| 2015 | $1,933 | $13,750 | $3,322 | $10,428 |
| 2014 | $1,928 | $13,750 | $3,322 | $10,428 |
Source: Public Records
Map
Nearby Homes
- 9330 S Oxford Ave
- 6307 E 94th Place
- 9416 S 69th East Ave
- 6723 E 97th St
- 6109 E 91st Place
- 9021 S Maplewood Ave
- 9752 S Lakewood Ave
- 9722 S 69th East Ave
- 9713 S 69th East Ave
- 6314 E 89th Place Unit 1203
- 6326 E 89th Place Unit 1006
- 6223 E 100th Place
- 9402 S 73rd East Ave
- 7101 E 99th St
- 8626 S 65th East Place
- 5818 E 101st Place
- 0 E 85th Ct Unit 2527614
- 8714 S 69th East Ave
- 5127 E 97th Ct
- 8718 S 72nd East Ave
- 9407 S Oxford Ave
- 9408 S Oxford Place
- 9406 S Oxford Place
- 9329 S Oxford Ave
- 6408 E 94th Place
- 6317 E 94th Place
- 6414 E 94th Place
- 9406 S Oxford Ave
- 9328 S Oxford Place
- 6320 E 94th Place
- 6418 E 94th Place
- 9323 S Oxford Ave
- 9322 S Oxford Place
- 6314 E 94th Place
- 6424 E 94th Place
- 9409 S Oxford Place
- 9407 S Norwood East Ave
- 9407 S Norwood Ave
- 9405 S Oxford Place
Your Personal Tour Guide
Ask me questions while you tour the home.