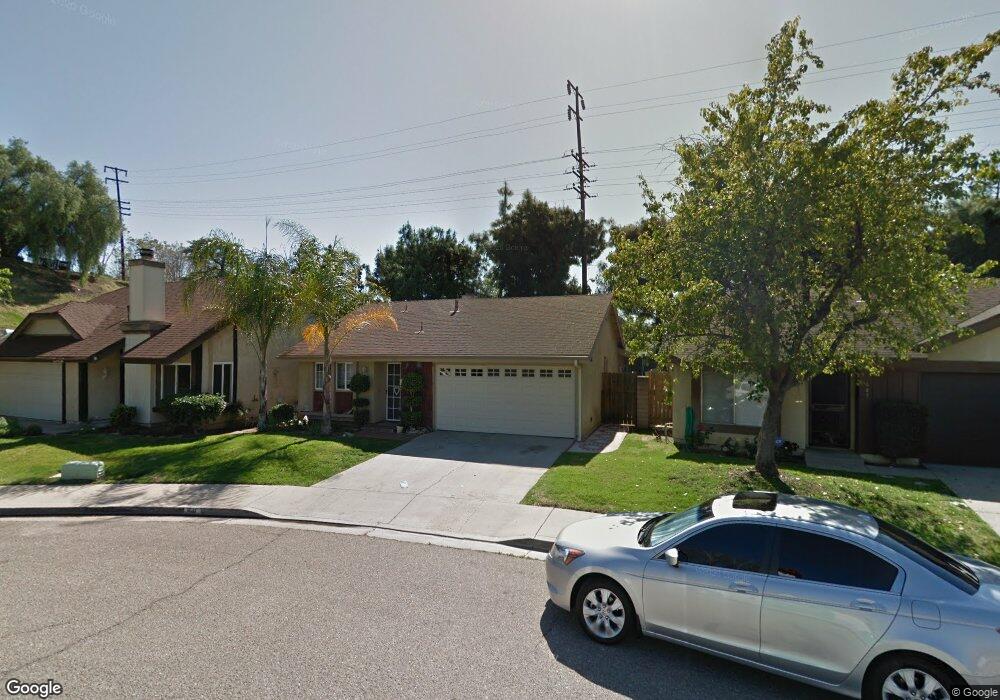
641 Fernglen Cir Fillmore, CA 93015
Estimated Value: $497,000 - $613,018
3
Beds
2
Baths
1,125
Sq Ft
$486/Sq Ft
Est. Value
About This Home
This home is located at 641 Fernglen Cir, Fillmore, CA 93015 and is currently estimated at $547,255, approximately $486 per square foot. 641 Fernglen Cir is a home located in Ventura County with nearby schools including San Cayetano Elementary School and Fillmore Senior High.
Ownership History
Date
Name
Owned For
Owner Type
Purchase Details
Closed on
Nov 1, 2017
Sold by
Luna Antonio V and Luna Margarita R
Bought by
Luna Antonio V and Luna Margarita R
Current Estimated Value
Purchase Details
Closed on
Jan 29, 1999
Sold by
Wells Fargo Bank Na
Bought by
Luna Antonio and Luna Margarita R
Home Financials for this Owner
Home Financials are based on the most recent Mortgage that was taken out on this home.
Original Mortgage
$100,000
Outstanding Balance
$23,751
Interest Rate
6.78%
Estimated Equity
$523,504
Purchase Details
Closed on
Sep 17, 1998
Sold by
Pelayo Maria E
Bought by
Wells Fargo Bank Na
Purchase Details
Closed on
Feb 24, 1994
Sold by
Pelayo Rigoberto and Pelayo Maria Estela
Bought by
Pelayo Maria Estela
Home Financials for this Owner
Home Financials are based on the most recent Mortgage that was taken out on this home.
Original Mortgage
$118,570
Interest Rate
6.37%
Create a Home Valuation Report for This Property
The Home Valuation Report is an in-depth analysis detailing your home's value as well as a comparison with similar homes in the area
Home Values in the Area
Average Home Value in this Area
Purchase History
| Date | Buyer | Sale Price | Title Company |
|---|---|---|---|
| Luna Antonio V | -- | None Available | |
| Luna Antonio | $140,000 | Fidelity National Title | |
| Wells Fargo Bank Na | $125,356 | Chicago Title Co | |
| Pelayo Maria Estela | -- | Commonwealth Land Title Co |
Source: Public Records
Mortgage History
| Date | Status | Borrower | Loan Amount |
|---|---|---|---|
| Open | Luna Antonio | $100,000 | |
| Previous Owner | Pelayo Maria Estela | $118,570 |
Source: Public Records
Tax History
| Year | Tax Paid | Tax Assessment Tax Assessment Total Assessment is a certain percentage of the fair market value that is determined by local assessors to be the total taxable value of land and additions on the property. | Land | Improvement |
|---|---|---|---|---|
| 2025 | $2,452 | $225,525 | $87,776 | $137,749 |
| 2024 | $2,452 | $221,103 | $86,054 | $135,049 |
| 2023 | $2,418 | $216,768 | $84,367 | $132,401 |
| 2022 | $2,235 | $212,518 | $82,713 | $129,805 |
| 2021 | $2,537 | $208,351 | $81,091 | $127,260 |
| 2020 | $2,354 | $206,216 | $80,260 | $125,956 |
| 2019 | $2,360 | $202,174 | $78,687 | $123,487 |
| 2018 | $2,311 | $198,211 | $77,145 | $121,066 |
| 2017 | $2,323 | $194,326 | $75,633 | $118,693 |
| 2016 | $2,151 | $190,516 | $74,150 | $116,366 |
| 2015 | $2,090 | $187,656 | $73,037 | $114,619 |
| 2014 | $2,057 | $181,333 | $71,607 | $109,726 |
Source: Public Records
Map
Nearby Homes
- 809 Woodgrove Rd
- 815 Woodgrove Rd
- 831 Blaine Ave
- 404 Central Ave
- 949 Blaine Ave
- 345 Blaine Ave
- 340 Central Ave
- 639 Mountain View St
- 318 Bard St
- 600 C St
- 616 Island View St
- 1106 Mockingbird Ln
- 313 C St
- 578 Apricot Ln
- 549 Heritage Valley Pkwy
- 513 Heritage Valley Pkwy
- 458 Edgewood Dr
- 81 Wildwood Ln
- 252 Driftwood St
- 1262 Sespe Ave
- 637 Fernglen Cir
- 647 Fernglen Cir
- 651 Fernglen Cir
- 630 A St
- 655 Fernglen Cir
- 646 Fernglen Cir
- 644 Fernglen Cir
- 652 Fernglen Cir
- 661 Fernglen Cir
- 640 Boulder St
- 656 Fernglen Cir
- 642 Fernglen Cir
- 634 Boulder St
- 646 Boulder St
- 639 Fernglen Cir
- 630 Boulder St
- 654 Boulder St
- 660 Fernglen Cir
- 636 Fernglen Cir
- 622 Boulder St
Your Personal Tour Guide
Ask me questions while you tour the home.