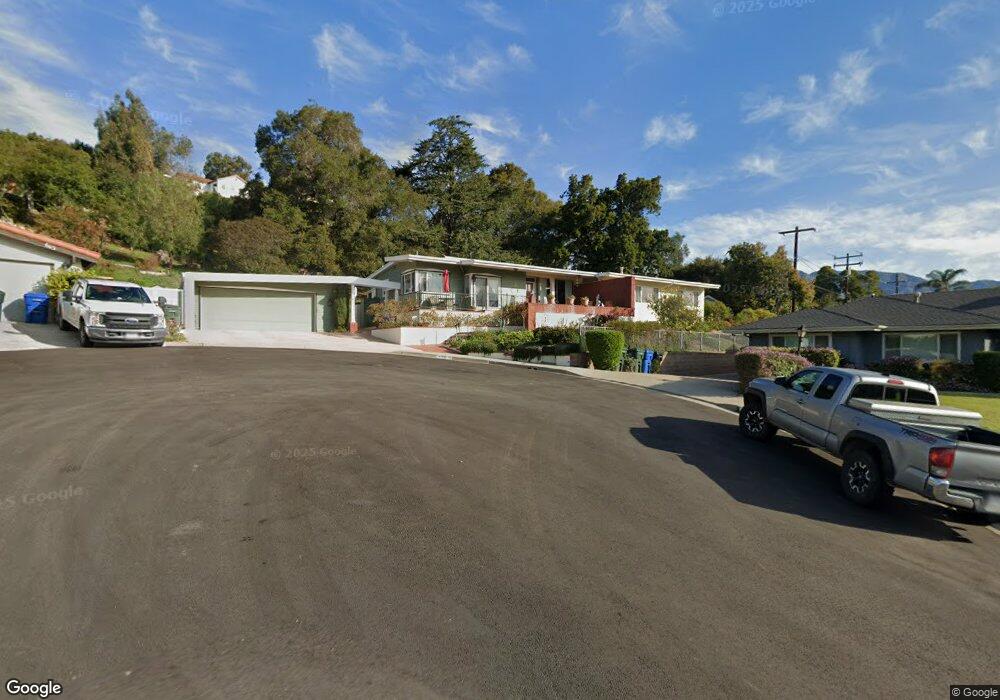
641 N 9th St Santa Paula, CA 93060
Estimated Value: $831,000 - $1,136,000
3
Beds
2
Baths
2,310
Sq Ft
$422/Sq Ft
Est. Value
About This Home
This home is located at 641 N 9th St, Santa Paula, CA 93060 and is currently estimated at $974,353, approximately $421 per square foot. 641 N 9th St is a home located in Ventura County with nearby schools including McKevett Elementary School, Isbell Middle School, and Santa Paula High.
Ownership History
Date
Name
Owned For
Owner Type
Purchase Details
Closed on
Mar 3, 2006
Sold by
Cossid Lawrence S and Cossid Michal J
Bought by
Cossid Lawrence S and Cossid Michal J
Current Estimated Value
Purchase Details
Closed on
Apr 5, 1999
Sold by
Hester Robert F and Hester Wanda L
Bought by
Cossid Lawrence S and Cossid Michal J
Home Financials for this Owner
Home Financials are based on the most recent Mortgage that was taken out on this home.
Original Mortgage
$232,000
Interest Rate
6.37%
Purchase Details
Closed on
Nov 4, 1998
Sold by
Hester Robert E and Hester Wanda L
Bought by
Hester Robert E and Hester Wanda L
Purchase Details
Closed on
Jul 9, 1998
Sold by
Hester Robert E and Hester Wanda L
Bought by
Hester Robert E and Hester Wanda L
Purchase Details
Closed on
Jun 8, 1998
Sold by
Hester Robert E and Hester Wanda L
Bought by
Hester Robert E and Hester Wanda L
Create a Home Valuation Report for This Property
The Home Valuation Report is an in-depth analysis detailing your home's value as well as a comparison with similar homes in the area
Home Values in the Area
Average Home Value in this Area
Purchase History
| Date | Buyer | Sale Price | Title Company |
|---|---|---|---|
| Cossid Lawrence S | -- | None Available | |
| Cossid Lawrence S | $290,000 | Chicago Title Co | |
| Hester Robert E | -- | -- | |
| Hester Robert E | -- | -- | |
| Hester Robert E | -- | -- |
Source: Public Records
Mortgage History
| Date | Status | Borrower | Loan Amount |
|---|---|---|---|
| Previous Owner | Cossid Lawrence S | $232,000 |
Source: Public Records
Tax History
| Year | Tax Paid | Tax Assessment Tax Assessment Total Assessment is a certain percentage of the fair market value that is determined by local assessors to be the total taxable value of land and additions on the property. | Land | Improvement |
|---|---|---|---|---|
| 2025 | $5,139 | $454,608 | $188,110 | $266,498 |
| 2024 | $5,139 | $445,695 | $184,422 | $261,273 |
| 2023 | $5,031 | $436,956 | $180,806 | $256,150 |
| 2022 | $4,884 | $428,389 | $177,261 | $251,128 |
| 2021 | $4,869 | $419,990 | $173,786 | $246,204 |
| 2020 | $4,845 | $415,686 | $172,005 | $243,681 |
| 2019 | $4,579 | $407,536 | $168,633 | $238,903 |
| 2018 | $4,521 | $399,546 | $165,327 | $234,219 |
| 2017 | $4,572 | $391,713 | $162,086 | $229,627 |
| 2016 | $4,296 | $384,033 | $158,908 | $225,125 |
| 2015 | $4,105 | $378,267 | $156,522 | $221,745 |
| 2014 | $4,169 | $370,859 | $153,457 | $217,402 |
Source: Public Records
Map
Nearby Homes
- 838 Crestview Ct
- 975 Loma Vista Place
- 864 Montclair Dr
- 815 Vista Grande Dr
- 417 N 8th St
- 887 Coronado Cir
- 933 E Santa Paula St
- 317 N Ojai St #Abcde
- 916 E Santa Paula St
- 738 E Santa Paula St
- 549 Glade Dr
- 179 View Dr
- 214 N 7th St
- 939 Laurel Rd
- 1234 Woodland Dr
- 426 N Palm Ave
- 0 Ojai Rd Unit V1-33724
- 0 Ojai Rd Unit V1-33728
- 180 E Pleasant St
- 573 Eureka Dr
- 637 N 9th St
- 633 N 9th St
- 642 N 9th St
- 638 N 9th St
- 634 N 10th St
- 634 N 9th St
- 907 Loma Vista Place
- 919 Loma Vista Place
- 822 Crestview Ct
- 630 N 10th St
- 630 N 9th St
- 836 Monte Vista Dr
- 833 Loma Vista Place
- 635 N 10th St
- 824 Monte Vista Dr
- 908 Loma Vista Place
- 914 Loma Vista Place
- 902 Loma Vista Place
- 850 Monte Vista Dr
- 918 Loma Vista Place
Your Personal Tour Guide
Ask me questions while you tour the home.