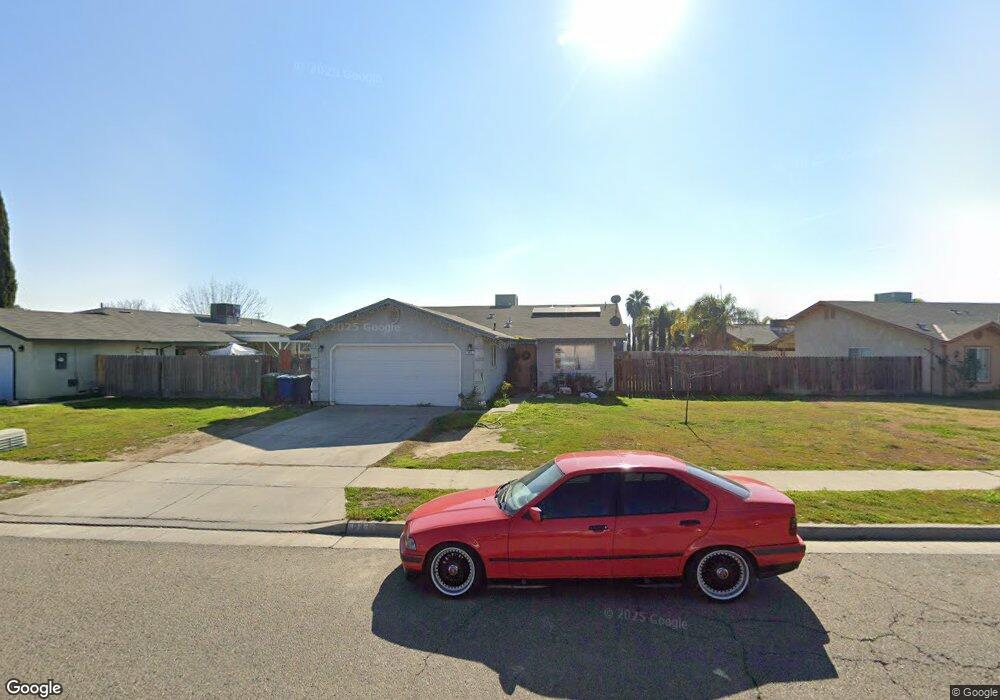
641 Otero St Lemoore, CA 93245
Estimated Value: $298,000 - $320,000
3
Beds
2
Baths
1,154
Sq Ft
$267/Sq Ft
Est. Value
About This Home
This home is located at 641 Otero St, Lemoore, CA 93245 and is currently estimated at $308,621, approximately $267 per square foot. 641 Otero St is a home located in Kings County with nearby schools including P.W. Engvall Elementary School, Liberty Middle School, and Lemoore High School.
Ownership History
Date
Name
Owned For
Owner Type
Purchase Details
Closed on
Jul 13, 2007
Sold by
Roa Rene
Bought by
Roa Rene and Roa Soledad
Current Estimated Value
Home Financials for this Owner
Home Financials are based on the most recent Mortgage that was taken out on this home.
Original Mortgage
$165,809
Outstanding Balance
$103,690
Interest Rate
6.51%
Mortgage Type
New Conventional
Estimated Equity
$204,931
Purchase Details
Closed on
Dec 17, 1998
Sold by
Roa Soledad
Bought by
Roa Rene
Home Financials for this Owner
Home Financials are based on the most recent Mortgage that was taken out on this home.
Original Mortgage
$44,261
Interest Rate
6.91%
Mortgage Type
FHA
Purchase Details
Closed on
Nov 2, 1998
Sold by
Self Help Enterprises
Bought by
Roa Rene
Home Financials for this Owner
Home Financials are based on the most recent Mortgage that was taken out on this home.
Original Mortgage
$44,261
Interest Rate
6.91%
Mortgage Type
FHA
Create a Home Valuation Report for This Property
The Home Valuation Report is an in-depth analysis detailing your home's value as well as a comparison with similar homes in the area
Home Values in the Area
Average Home Value in this Area
Purchase History
| Date | Buyer | Sale Price | Title Company |
|---|---|---|---|
| Roa Rene | -- | Lsi | |
| Roa Rene | -- | Chicago Title Co | |
| Roa Rene | $94,000 | Chicago Title Co |
Source: Public Records
Mortgage History
| Date | Status | Borrower | Loan Amount |
|---|---|---|---|
| Open | Roa Rene | $165,809 | |
| Previous Owner | Roa Rene | $44,261 | |
| Closed | Roa Rene | $30,200 |
Source: Public Records
Tax History
| Year | Tax Paid | Tax Assessment Tax Assessment Total Assessment is a certain percentage of the fair market value that is determined by local assessors to be the total taxable value of land and additions on the property. | Land | Improvement |
|---|---|---|---|---|
| 2025 | $1,548 | $147,361 | $43,893 | $103,468 |
| 2023 | $1,548 | $141,641 | $42,190 | $99,451 |
| 2022 | $1,622 | $138,864 | $41,363 | $97,501 |
| 2021 | $1,583 | $136,142 | $40,552 | $95,590 |
| 2020 | $1,574 | $134,746 | $40,136 | $94,610 |
| 2019 | $1,563 | $132,104 | $39,349 | $92,755 |
| 2018 | $1,471 | $129,513 | $38,577 | $90,936 |
| 2017 | $1,475 | $126,974 | $37,821 | $89,153 |
| 2016 | $1,390 | $124,484 | $37,079 | $87,405 |
| 2015 | $1,385 | $122,614 | $36,522 | $86,092 |
| 2014 | $1,346 | $120,213 | $35,807 | $84,406 |
Source: Public Records
Map
Nearby Homes
Your Personal Tour Guide
Ask me questions while you tour the home.