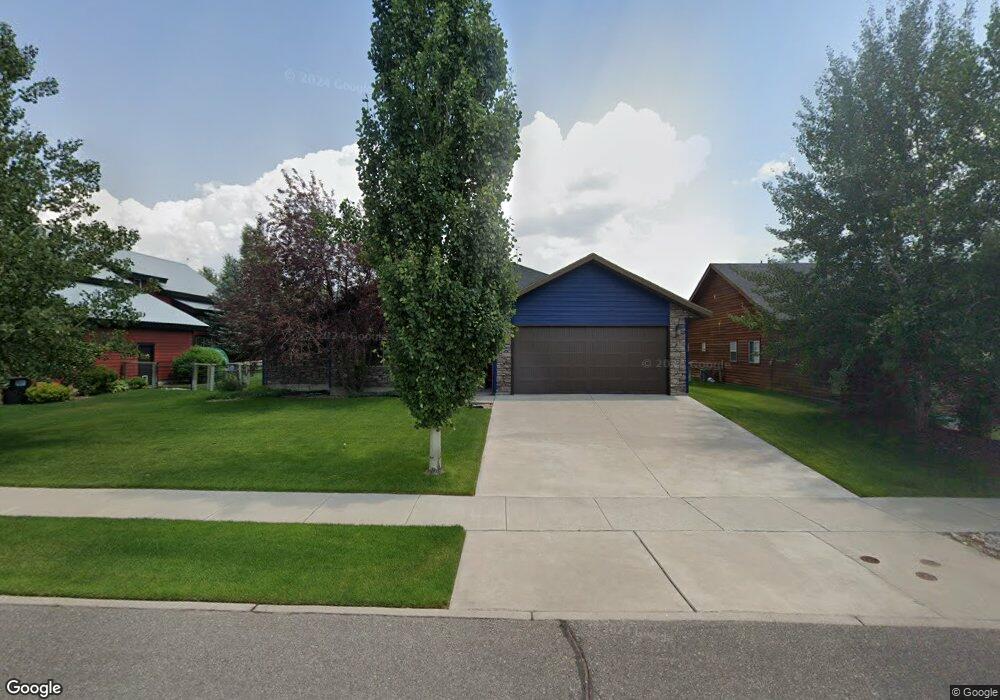
641 Palisade Trail Driggs, ID 83422
Estimated Value: $840,000 - $903,000
3
Beds
2
Baths
1,545
Sq Ft
$563/Sq Ft
Est. Value
About This Home
This home is located at 641 Palisade Trail, Driggs, ID 83422 and is currently estimated at $869,842, approximately $563 per square foot. 641 Palisade Trail is a home located in Teton County with nearby schools including Driggs Elementary School, Teton High School, and The Learning Academy of Teton Valley.
Ownership History
Date
Name
Owned For
Owner Type
Purchase Details
Closed on
Apr 2, 2024
Sold by
Aa Real Property Inv Llc
Bought by
Joseph Francis Foster And Heather Marie Foste and Foster
Current Estimated Value
Purchase Details
Closed on
Mar 20, 2024
Sold by
Peaked Properties Llc
Bought by
Friedman Noah and Anna Bugankova
Purchase Details
Closed on
May 19, 2021
Sold by
Flahavin Ellen E and Ellen E Flahavin Revocable Tru
Bought by
Flahavin James and Ellen E Flahavin Revocable Tru
Purchase Details
Closed on
Apr 21, 2010
Sold by
Flahavin Ellen E
Bought by
Flahavin Ellen E and Ellen E Flahavin Revocable Living Trust
Purchase Details
Closed on
Nov 6, 2007
Sold by
Jw Reylance Construction
Bought by
Flahavin Ellen E
Home Financials for this Owner
Home Financials are based on the most recent Mortgage that was taken out on this home.
Original Mortgage
$82,650
Interest Rate
6.4%
Mortgage Type
New Conventional
Create a Home Valuation Report for This Property
The Home Valuation Report is an in-depth analysis detailing your home's value as well as a comparison with similar homes in the area
Home Values in the Area
Average Home Value in this Area
Purchase History
| Date | Buyer | Sale Price | Title Company |
|---|---|---|---|
| Joseph Francis Foster And Heather Marie Foste | -- | Alliance Title | |
| Friedman Noah | -- | Alliance Title | |
| Flahavin James | -- | None Available | |
| Flahavin Ellen E | -- | -- | |
| Flahavin Ellen E | -- | -- |
Source: Public Records
Mortgage History
| Date | Status | Borrower | Loan Amount |
|---|---|---|---|
| Previous Owner | Flahavin Ellen E | $82,650 |
Source: Public Records
Tax History Compared to Growth
Tax History
| Year | Tax Paid | Tax Assessment Tax Assessment Total Assessment is a certain percentage of the fair market value that is determined by local assessors to be the total taxable value of land and additions on the property. | Land | Improvement |
|---|---|---|---|---|
| 2025 | $3,278 | $783,261 | $140,000 | $643,261 |
| 2024 | $3,109 | $732,631 | $120,000 | $612,631 |
| 2023 | $3,109 | $732,631 | $120,000 | $612,631 |
| 2022 | $3,290 | $632,844 | $100,000 | $532,844 |
| 2021 | $3,509 | $417,089 | $45,000 | $372,089 |
| 2020 | $3,519 | $342,800 | $38,000 | $304,800 |
| 2019 | $2,991 | $293,274 | $35,000 | $258,274 |
| 2018 | $2,920 | $264,802 | $32,000 | $232,802 |
| 2017 | $2,674 | $262,802 | $30,000 | $232,802 |
| 2016 | $2,490 | $226,610 | $26,000 | $200,610 |
| 2015 | $2,450 | $197,511 | $23,000 | $174,511 |
| 2011 | -- | $178,516 | $20,000 | $158,516 |
Source: Public Records
Map
Nearby Homes
- 652 Palisade Trail
- 668 Palisade Trail
- 551 Palisade Trail
- 535 Palisade Trail
- 525 Booshway
- 1021 Farmers Trail
- 398 Palisade Trail
- 1025 Cahuilla Rd
- 1066 Pawnee Rd
- 1046 Pawnee Rd
- 8720 Appaloosa Trail
- 624 Easy St
- 125 Cobble Creek Ln Unit 75
- 101 Cobble Creek Ln
- L190 Iroquois Way
- 1045 Iroquois Way
- 112 Aspen Meadows Rd Unit U36
- 560 Appaloosa Trail
- 570 Easy St
- 1121 Rainbow Loop
- 625 Palisade Trail
- 655 Palisade Trail
- LOT 82 Shoshoni Plains
- LOT 81 Shoshoni Plains
- 609 Palisade Trail
- 1165 Wind River Trail
- 1081 Wind River Trail
- 695 Palisade Trail
- LOT 83 Shoshoni Plains
- 1179 Wind River Trail
- 684 Palisade Trail
- LOT 95 Palisade Trail
- LOT 99 Palisade Trail
- LOT 97 Palisade Trail
- LOT 92 Palisade Trail
- LOT 90 Palisade Trail
- LOT 87 Palisade Trail
- LOT 100 Palisade Trail
- LOT 54 Palisade Trail
- LOT 55 Palisade Trail