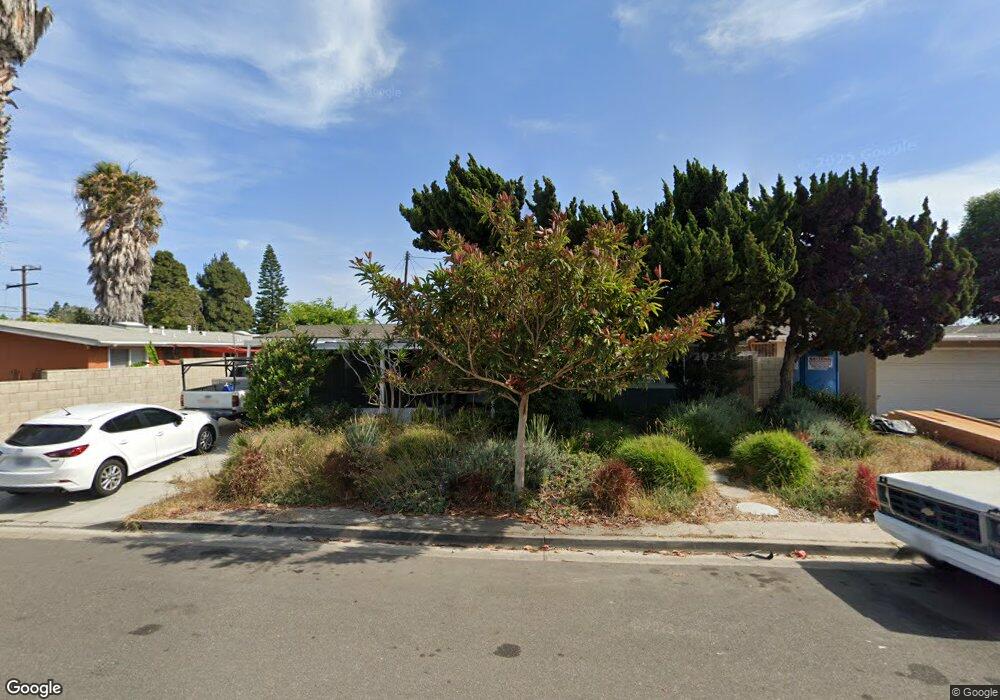
641 Ross St Costa Mesa, CA 92627
Downtown Costa Mesa NeighborhoodEstimated Value: $1,140,000 - $1,266,000
4
Beds
2
Baths
1,150
Sq Ft
$1,056/Sq Ft
Est. Value
About This Home
This home is located at 641 Ross St, Costa Mesa, CA 92627 and is currently estimated at $1,214,149, approximately $1,055 per square foot. 641 Ross St is a home located in Orange County with nearby schools including Everett A. Rea Elementary School, Charles W. Tewinkle Middle School, and Estancia High School.
Ownership History
Date
Name
Owned For
Owner Type
Purchase Details
Closed on
Aug 3, 2000
Sold by
Susman Stan J and Susman Joan W
Bought by
Susman Stan J and Susman Joan W
Current Estimated Value
Purchase Details
Closed on
Apr 19, 2000
Sold by
Ronnie Ross and Ronnie Stephanie Quinn
Bought by
Susman Stan J and Susman Joan W
Home Financials for this Owner
Home Financials are based on the most recent Mortgage that was taken out on this home.
Original Mortgage
$170,400
Interest Rate
8.25%
Purchase Details
Closed on
Mar 12, 1998
Sold by
Bailey Betty E and Bailey Lewis N
Bought by
Ross Ronnie J and Quinn Stephanie C
Home Financials for this Owner
Home Financials are based on the most recent Mortgage that was taken out on this home.
Original Mortgage
$115,500
Interest Rate
7.06%
Create a Home Valuation Report for This Property
The Home Valuation Report is an in-depth analysis detailing your home's value as well as a comparison with similar homes in the area
Home Values in the Area
Average Home Value in this Area
Purchase History
| Date | Buyer | Sale Price | Title Company |
|---|---|---|---|
| Susman Stan J | -- | -- | |
| Susman Stan J | $213,000 | American Title Co | |
| Ross Ronnie J | $165,000 | Guardian Title |
Source: Public Records
Mortgage History
| Date | Status | Borrower | Loan Amount |
|---|---|---|---|
| Previous Owner | Susman Stan J | $170,400 | |
| Previous Owner | Ross Ronnie J | $115,500 |
Source: Public Records
Tax History
| Year | Tax Paid | Tax Assessment Tax Assessment Total Assessment is a certain percentage of the fair market value that is determined by local assessors to be the total taxable value of land and additions on the property. | Land | Improvement |
|---|---|---|---|---|
| 2025 | $4,389 | $327,366 | $262,973 | $64,393 |
| 2024 | $4,389 | $320,948 | $257,817 | $63,131 |
| 2023 | $4,218 | $314,655 | $252,761 | $61,894 |
| 2022 | $4,037 | $308,486 | $247,805 | $60,681 |
| 2021 | $3,896 | $302,438 | $242,946 | $59,492 |
| 2020 | $3,845 | $299,337 | $240,455 | $58,882 |
| 2019 | $3,763 | $293,468 | $235,740 | $57,728 |
| 2018 | $3,688 | $287,714 | $231,117 | $56,597 |
| 2017 | $3,629 | $282,073 | $226,585 | $55,488 |
| 2016 | $3,556 | $276,543 | $222,143 | $54,400 |
| 2015 | $3,522 | $272,390 | $218,807 | $53,583 |
| 2014 | $3,445 | $267,055 | $214,521 | $52,534 |
Source: Public Records
Map
Nearby Homes
- 1974 Meyer Place Unit D
- 664 Center St Unit A B & C
- 525 Fairfax Dr Unit 2
- 525 Fairfax Dr Unit 28
- 1925 Wallace Ave
- 726 Weelo Dr
- 2023 Placentia Ave
- 425 Ford Rd
- 451 Parker Dam Rd Unit B-11
- 155 Unit A Flower
- 401 Bernard St Unit 211
- 401 Bernard St Unit 202
- 809 Brickyard Ln
- 686 Governor St
- 329 Ford Rd
- 2171 Pomona Ave
- 2187 Meyer Place
- 1973 Newport Blvd Unit 3
- 1973 Newport Blvd Unit 10
- 2191 Harbor Blvd Unit 65
Your Personal Tour Guide
Ask me questions while you tour the home.