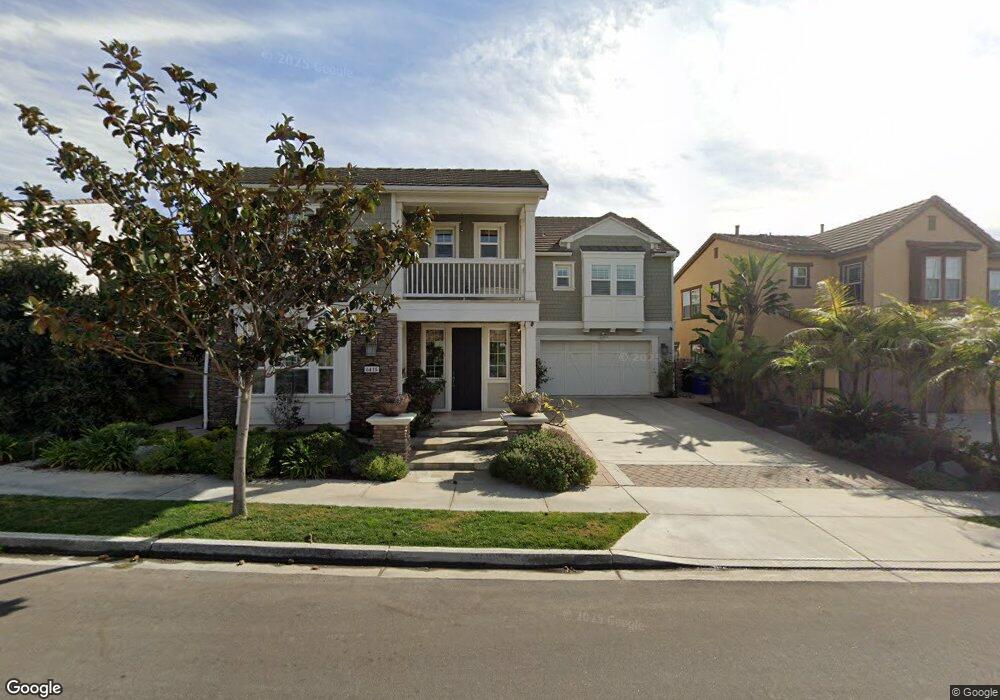
6415 Cypress Meadows Trail San Diego, CA 92130
Carmel Valley NeighborhoodEstimated Value: $3,214,000 - $3,643,000
5
Beds
5
Baths
4,351
Sq Ft
$777/Sq Ft
Est. Value
About This Home
This home is located at 6415 Cypress Meadows Trail, San Diego, CA 92130 and is currently estimated at $3,381,433, approximately $777 per square foot. 6415 Cypress Meadows Trail is a home with nearby schools including Solana Ranch Elementary School, Pacific Trails Middle, and Torrey Pines High School.
Ownership History
Date
Name
Owned For
Owner Type
Purchase Details
Closed on
Sep 2, 2021
Sold by
Yan Wen
Bought by
Yan Wen and Zhang Alexander
Current Estimated Value
Home Financials for this Owner
Home Financials are based on the most recent Mortgage that was taken out on this home.
Original Mortgage
$410,000
Interest Rate
2.37%
Mortgage Type
New Conventional
Purchase Details
Closed on
Jul 27, 2021
Sold by
Zhang Jay
Bought by
Yan Wen
Home Financials for this Owner
Home Financials are based on the most recent Mortgage that was taken out on this home.
Original Mortgage
$410,000
Interest Rate
2.37%
Mortgage Type
New Conventional
Purchase Details
Closed on
Mar 14, 2014
Sold by
Pardee Homes
Bought by
Yan Wen and Zhang Jay
Home Financials for this Owner
Home Financials are based on the most recent Mortgage that was taken out on this home.
Original Mortgage
$550,000
Interest Rate
3.12%
Mortgage Type
New Conventional
Create a Home Valuation Report for This Property
The Home Valuation Report is an in-depth analysis detailing your home's value as well as a comparison with similar homes in the area
Home Values in the Area
Average Home Value in this Area
Purchase History
| Date | Buyer | Sale Price | Title Company |
|---|---|---|---|
| Yan Wen | -- | None Listed On Document | |
| Yan Wen | -- | Fidelity National Title Co | |
| Yan Wen | $1,362,000 | Chicago Title Company |
Source: Public Records
Mortgage History
| Date | Status | Borrower | Loan Amount |
|---|---|---|---|
| Previous Owner | Yan Wen | $410,000 | |
| Previous Owner | Yan Wen | $550,000 |
Source: Public Records
Tax History Compared to Growth
Tax History
| Year | Tax Paid | Tax Assessment Tax Assessment Total Assessment is a certain percentage of the fair market value that is determined by local assessors to be the total taxable value of land and additions on the property. | Land | Improvement |
|---|---|---|---|---|
| 2025 | $19,542 | $1,636,791 | $781,199 | $855,592 |
| 2024 | $19,542 | $1,604,698 | $765,882 | $838,816 |
| 2023 | $19,160 | $1,573,234 | $750,865 | $822,369 |
| 2022 | $18,874 | $1,542,388 | $736,143 | $806,245 |
| 2021 | $18,565 | $1,512,146 | $721,709 | $790,437 |
| 2020 | $18,419 | $1,496,642 | $714,309 | $782,333 |
| 2019 | $18,101 | $1,467,297 | $700,303 | $766,994 |
| 2018 | $17,796 | $1,438,527 | $686,572 | $751,955 |
| 2017 | $17,543 | $1,410,321 | $673,110 | $737,211 |
| 2016 | $17,060 | $1,382,668 | $659,912 | $722,756 |
| 2015 | $16,861 | $1,361,900 | $650,000 | $711,900 |
| 2014 | $3,059 | $14,344 | $14,344 | $0 |
Source: Public Records
Map
Nearby Homes
- 6336 Sagebrush Bend Way
- 13563 Chamise Vista Ln
- 13568 Bolero Way
- 13441 Banyan Way
- 6265 Silverbush Creek St
- 6222 Artisan Way
- 14619 Calle Carla
- 6744 Monterra Trail
- 13348 Camelia Way
- 7001 Via Agave
- 14786 Rancho Santa Fe Farms Rd
- 13032 Alora Point Unit 170
- 7066 Via Agave
- 12932 Peppergrass Creek Gate Unit 58
- 13016 Lumen Way
- 13033 Lamia Point Unit 217
- 13233 Petunia Way
- 13165 Caminito Mendiola
- 5936 Fairway Place
- 5347 Morning Sage Way
- 6411 Cypress Meadows Trail
- 6421 Cypress Meadows Trail
- 6427 Cypress Meadows Trail
- 6416 Cypress Meadows Trail
- 6412 Cypress Meadows Trail
- 6420 Cypress Meadows Trail
- 6408 Cypress Meadows Trail
- 6424 Cypress Meadows Trail
- 6431 Cypress Meadows Trail
- 13658 Golden Cypress Place
- 13662 Golden Cypress Place
- 6428 Cypress Meadows Trail
- 6435 Cypress Meadows Trail
- 13671 Golden Cypress Place
- 13668 Golden Cypress Place
- 6371 Meadowbrush Cir
- 6379 Meadowbrush Cir
- 6432 Cypress Meadows Trail
- 6347 Golden Lily Way
- 13670 Golden Cypress Place