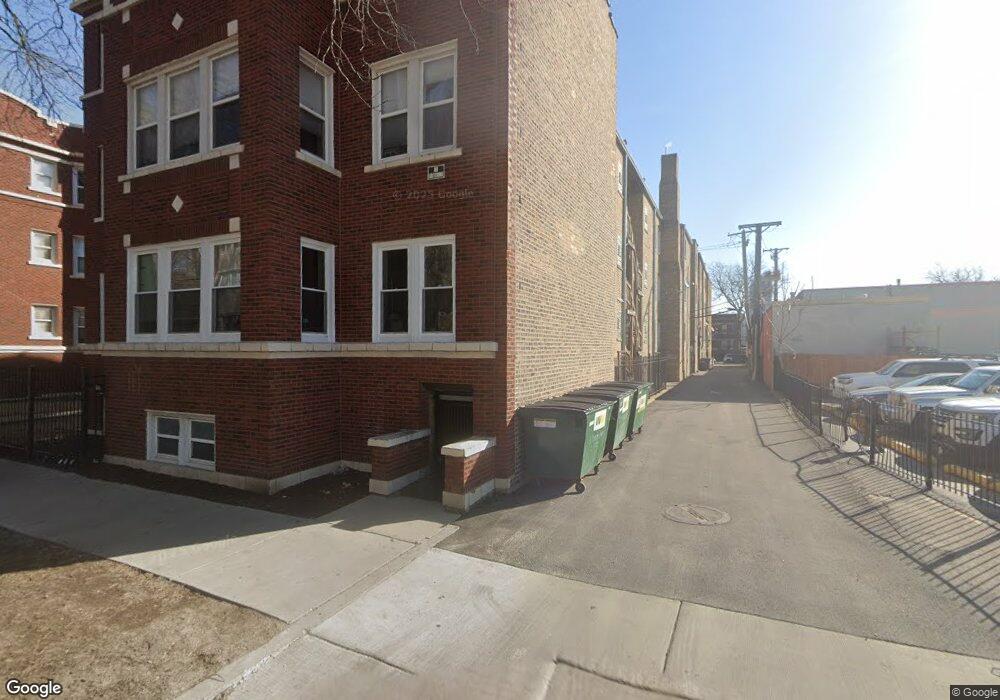
6415 N Greenview Ave Unit 6415 Chicago, IL 60626
Rogers Park NeighborhoodEstimated Value: $217,000 - $238,000
2
Beds
1
Bath
--
Sq Ft
0.31
Acres
About This Home
This home is located at 6415 N Greenview Ave Unit 6415, Chicago, IL 60626 and is currently estimated at $224,932. 6415 N Greenview Ave Unit 6415 is a home located in Cook County with nearby schools including Kilmer Elementary School, Senn High School, and Northside Catholic Academy.
Ownership History
Date
Name
Owned For
Owner Type
Purchase Details
Closed on
Mar 4, 2014
Sold by
Federal Home Loan Mortgage Corporation
Bought by
Wang Siqi and Wang Siwen
Current Estimated Value
Purchase Details
Closed on
Sep 20, 2013
Sold by
Gonzales Maria C
Bought by
Federal Home Loan Mortgage Corporation
Purchase Details
Closed on
Jul 6, 2006
Sold by
Gonzales Ruben O
Bought by
Gonzales Aaron and Gonzales Maria C
Home Financials for this Owner
Home Financials are based on the most recent Mortgage that was taken out on this home.
Original Mortgage
$155,610
Interest Rate
6.68%
Mortgage Type
New Conventional
Purchase Details
Closed on
Jun 6, 2006
Sold by
6415 Greenview Llc
Bought by
Gonzales Ruben O
Home Financials for this Owner
Home Financials are based on the most recent Mortgage that was taken out on this home.
Original Mortgage
$155,610
Interest Rate
6.68%
Mortgage Type
New Conventional
Create a Home Valuation Report for This Property
The Home Valuation Report is an in-depth analysis detailing your home's value as well as a comparison with similar homes in the area
Home Values in the Area
Average Home Value in this Area
Purchase History
| Date | Buyer | Sale Price | Title Company |
|---|---|---|---|
| Wang Siqi | $104,000 | Attorneys Title Guaranty Fun | |
| Federal Home Loan Mortgage Corporation | -- | None Available | |
| Gonzales Aaron | -- | None Available | |
| Gonzales Ruben O | $173,000 | Multiple |
Source: Public Records
Mortgage History
| Date | Status | Borrower | Loan Amount |
|---|---|---|---|
| Previous Owner | Gonzales Ruben O | $155,610 |
Source: Public Records
Tax History Compared to Growth
Tax History
| Year | Tax Paid | Tax Assessment Tax Assessment Total Assessment is a certain percentage of the fair market value that is determined by local assessors to be the total taxable value of land and additions on the property. | Land | Improvement |
|---|---|---|---|---|
| 2024 | $3,165 | $14,592 | $1,088 | $13,504 |
| 2023 | $3,085 | $15,000 | $879 | $14,121 |
| 2022 | $3,085 | $15,000 | $879 | $14,121 |
| 2021 | $3,016 | $14,999 | $878 | $14,121 |
| 2020 | $1,887 | $8,471 | $795 | $7,676 |
| 2019 | $1,902 | $9,468 | $795 | $8,673 |
| 2018 | $1,870 | $9,468 | $795 | $8,673 |
| 2017 | $1,902 | $8,836 | $711 | $8,125 |
| 2016 | $1,770 | $8,836 | $711 | $8,125 |
| 2015 | $1,619 | $8,836 | $711 | $8,125 |
| 2014 | $735 | $6,529 | $690 | $5,839 |
| 2013 | $709 | $6,529 | $690 | $5,839 |
Source: Public Records
Map
Nearby Homes
- 1435 W Arthur Ave Unit 1
- 1513 W Highland Ave
- 1542 W Highland Ave
- 6447 N Glenwood Ave
- 1457 W Rosemont Ave Unit G
- 6532 N Ashland Ave
- 1626 W Highland Ave Unit 1W
- 6414 N Paulina St Unit G
- 1336 W Albion Ave Unit 2E
- 6628 N Bosworth Ave
- 6328 N Magnolia Ave
- 6316 N Magnolia Ave
- 6335 N Magnolia Ave Unit G
- 6321 N Hermitage Ave
- 1243 W Rosemont Ave Unit 12433
- 6646 N Ashland Ave Unit 3
- 1723 W Thome Ave
- 1331 W Granville Ave
- 1703 W Wallen Ave Unit 3C
- 1762 W Highland Ave Unit 104
- 6419 N Greenview Ave Unit 1S
- 6419 N Greenview Ave Unit 6419
- 6415 N Greenview Ave Unit 6415
- 6415 N Greenview Ave Unit 6415
- 6415 N Greenview Ave Unit 6415
- 6415 N Greenview Ave Unit 6415
- 6419 N Greenview Ave Unit 6419
- 6419 N Greenview Ave Unit 6419
- 6419 N Greenview Ave Unit 6419
- 6415 N Greenview Ave Unit 6415
- 6419 N Greenview Ave Unit 6419
- 6419 N Greenview Ave Unit 6419
- 6415 N Greenview Ave Unit 6415
- 6415 N Greenview Ave Unit 6415
- 6415 N Greenview Ave Unit OW
- 6419 N Greenview Ave Unit 3N
- 6415 N Greenview Ave Unit 3E
- 6419 N Greenview Ave Unit 2N
- 6419 N Greenview Ave Unit 2S
- 6415 N Greenview Ave Unit 2W