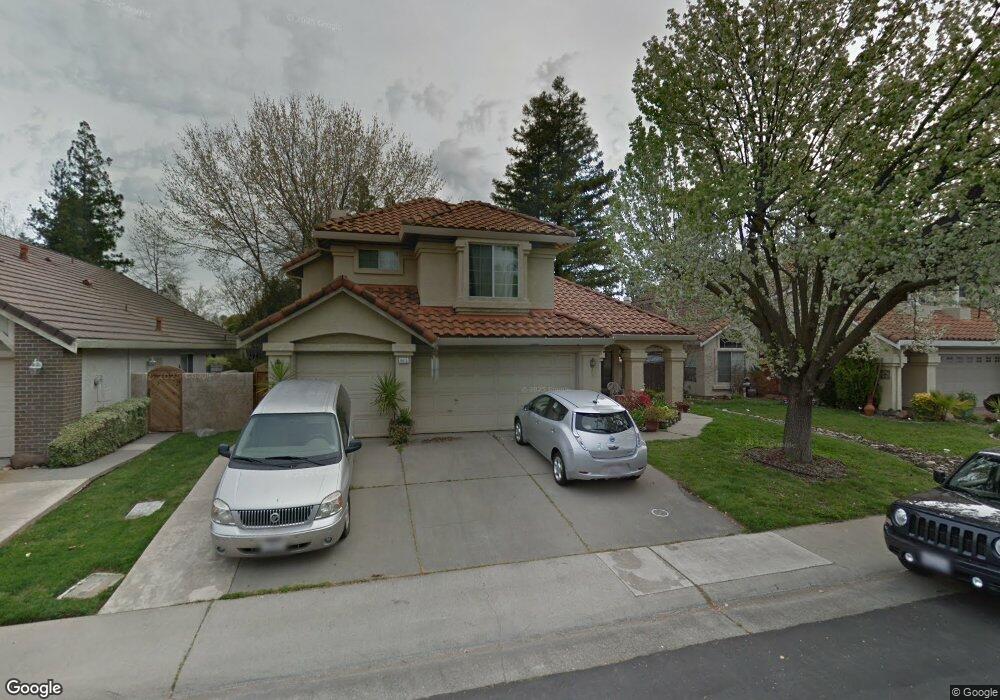
6415 Silver Hawk Way Elk Grove, CA 95758
North West Elk Grove NeighborhoodEstimated Value: $400,000 - $608,000
4
Beds
3
Baths
1,906
Sq Ft
$287/Sq Ft
Est. Value
About This Home
This home is located at 6415 Silver Hawk Way, Elk Grove, CA 95758 and is currently estimated at $547,106, approximately $287 per square foot. 6415 Silver Hawk Way is a home located in Sacramento County with nearby schools including John Ehrhardt Elementary School, Harriet G. Eddy Middle School, and Laguna Creek High School.
Ownership History
Date
Name
Owned For
Owner Type
Purchase Details
Closed on
Sep 23, 1999
Sold by
Beth Anderson Daniel J and Beth Mary
Bought by
Taylor Lawrence S and Taylor Tracy D
Current Estimated Value
Home Financials for this Owner
Home Financials are based on the most recent Mortgage that was taken out on this home.
Original Mortgage
$162,000
Interest Rate
7.75%
Purchase Details
Closed on
Jul 10, 1997
Sold by
Walker Myers Raymond Arthur and Walker Suzette
Bought by
Anderson Daniel J and Anderson Mary Beth
Home Financials for this Owner
Home Financials are based on the most recent Mortgage that was taken out on this home.
Original Mortgage
$128,000
Interest Rate
7%
Create a Home Valuation Report for This Property
The Home Valuation Report is an in-depth analysis detailing your home's value as well as a comparison with similar homes in the area
Home Values in the Area
Average Home Value in this Area
Purchase History
| Date | Buyer | Sale Price | Title Company |
|---|---|---|---|
| Taylor Lawrence S | $182,000 | Commonwealth Land Title Co | |
| Anderson Daniel J | $160,000 | Chicago Title Co |
Source: Public Records
Mortgage History
| Date | Status | Borrower | Loan Amount |
|---|---|---|---|
| Previous Owner | Taylor Lawrence S | $162,000 | |
| Previous Owner | Anderson Daniel J | $128,000 |
Source: Public Records
Tax History Compared to Growth
Tax History
| Year | Tax Paid | Tax Assessment Tax Assessment Total Assessment is a certain percentage of the fair market value that is determined by local assessors to be the total taxable value of land and additions on the property. | Land | Improvement |
|---|---|---|---|---|
| 2025 | $3,417 | $279,703 | $66,998 | $212,705 |
| 2024 | $3,417 | $274,220 | $65,685 | $208,535 |
| 2023 | $3,321 | $268,845 | $64,398 | $204,447 |
| 2022 | $3,181 | $263,575 | $63,136 | $200,439 |
| 2021 | $3,115 | $258,408 | $61,899 | $196,509 |
| 2020 | $3,069 | $255,760 | $61,265 | $194,495 |
| 2019 | $3,009 | $250,746 | $60,064 | $190,682 |
| 2018 | $2,928 | $245,831 | $58,887 | $186,944 |
| 2017 | $2,869 | $241,012 | $57,733 | $183,279 |
| 2016 | $2,739 | $236,287 | $56,601 | $179,686 |
| 2015 | $2,684 | $232,738 | $55,751 | $176,987 |
| 2014 | $2,648 | $228,180 | $54,659 | $173,521 |
Source: Public Records
Map
Nearby Homes
- 6925 Risata Way
- 6009 Greybridge Ct
- 6465 Laguna Mirage Ln
- 6348 Laguna Mirage Ln
- 0 Elliott Ranch Rd Unit 225131105
- 7013 Sandy Souza Way
- 6131 Jacinto Ave
- 8939 Generations Ct
- 5501 Big Creek Way
- 6024 Deepdale Way
- 1312 Winterhart St
- 7213 Tiant Way
- 7212 Tiant Way
- 6411 Jacinto Ave
- 6411 Jacinto Way
- 8741 Noble Fir Ln
- 6419 Jacinto Ave
- 6419 Jacinto Way
- 7515 Sheldon Rd Unit 4103
- 7105 Fall Way
- 6419 Silver Hawk Way
- 6411 Silver Hawk Way
- 6423 Silver Hawk Way
- 6405 Silver Hawk Way
- 8954 White Star Way
- 8958 White Star Way
- 8941 Laguna Star Dr
- 8950 White Star Way
- 8937 Laguna Star Dr
- 6416 Silver Hawk Way
- 6412 Silver Hawk Way
- 6420 Silver Hawk Way
- 6431 Silver Hawk Way
- 6408 Silver Hawk Way
- 8951 Laguna Star Dr
- 8946 White Star Way
- 6424 Silver Hawk Way
- 6404 Silver Hawk Way
- 8945 Laguna Star Dr
- 8942 White Star Way