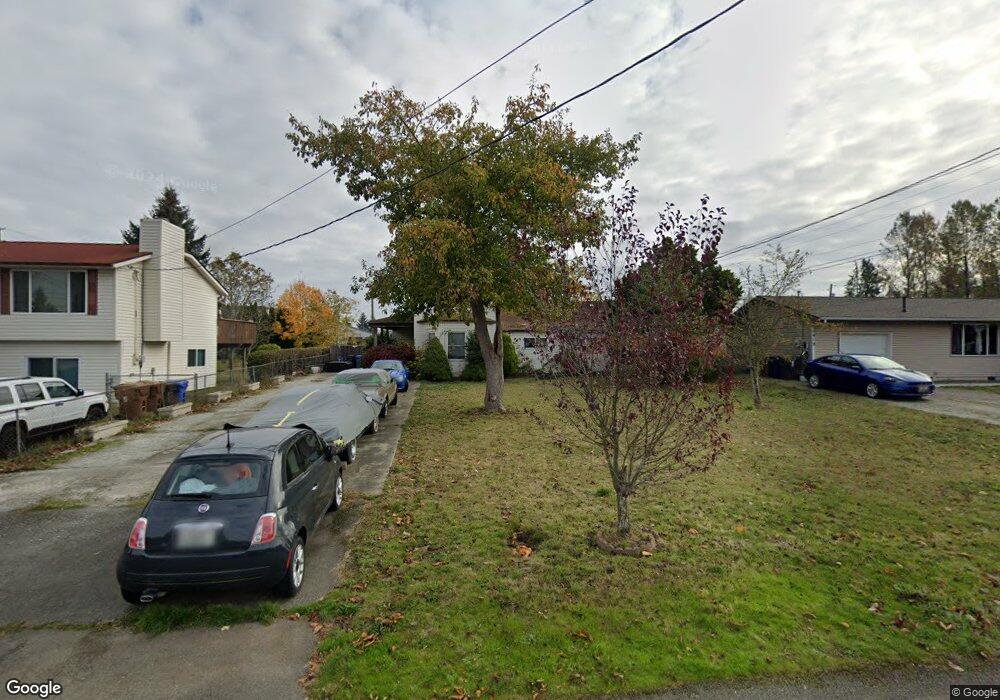
6417 E E St Tacoma, WA 98404
Eastside NeighborhoodEstimated Value: $421,000 - $488,719
3
Beds
1
Bath
1,620
Sq Ft
$279/Sq Ft
Est. Value
About This Home
This home is located at 6417 E E St, Tacoma, WA 98404 and is currently estimated at $452,430, approximately $279 per square foot. 6417 E E St is a home located in Pierce County with nearby schools including Oakland High School, Hunt Middle School, and Mount Tahoma High School.
Ownership History
Date
Name
Owned For
Owner Type
Purchase Details
Closed on
Feb 20, 1998
Sold by
Va
Bought by
Barton John C and Barton Ilene M
Current Estimated Value
Home Financials for this Owner
Home Financials are based on the most recent Mortgage that was taken out on this home.
Original Mortgage
$82,450
Outstanding Balance
$14,557
Interest Rate
6.97%
Estimated Equity
$437,873
Purchase Details
Closed on
Aug 8, 1997
Sold by
Sybers James H
Bought by
Fleet Mtg Corp and Fleet Real Estate Funding Corp
Home Financials for this Owner
Home Financials are based on the most recent Mortgage that was taken out on this home.
Original Mortgage
$80,949
Interest Rate
7.57%
Mortgage Type
Seller Take Back
Purchase Details
Closed on
May 8, 1997
Sold by
Fleet Mtg Corp
Bought by
Va
Create a Home Valuation Report for This Property
The Home Valuation Report is an in-depth analysis detailing your home's value as well as a comparison with similar homes in the area
Home Values in the Area
Average Home Value in this Area
Purchase History
| Date | Buyer | Sale Price | Title Company |
|---|---|---|---|
| Barton John C | -- | Transnation Title Insurance | |
| Fleet Mtg Corp | $70,897 | -- | |
| Va | -- | -- |
Source: Public Records
Mortgage History
| Date | Status | Borrower | Loan Amount |
|---|---|---|---|
| Open | Barton John C | $82,450 | |
| Previous Owner | Fleet Mtg Corp | $80,949 |
Source: Public Records
Tax History
| Year | Tax Paid | Tax Assessment Tax Assessment Total Assessment is a certain percentage of the fair market value that is determined by local assessors to be the total taxable value of land and additions on the property. | Land | Improvement |
|---|---|---|---|---|
| 2025 | $3,776 | $369,800 | $214,800 | $155,000 |
| 2024 | $3,776 | $361,600 | $207,000 | $154,600 |
| 2023 | $3,776 | $338,900 | $197,100 | $141,800 |
| 2022 | $3,708 | $383,100 | $189,000 | $194,100 |
| 2021 | $3,398 | $270,100 | $120,300 | $149,800 |
| 2019 | $2,786 | $241,200 | $99,500 | $141,700 |
| 2018 | $2,884 | $214,100 | $80,600 | $133,500 |
| 2017 | $2,556 | $182,400 | $66,200 | $116,200 |
| 2016 | $2,234 | $138,000 | $49,500 | $88,500 |
| 2014 | $1,976 | $128,400 | $46,700 | $81,700 |
| 2013 | $1,976 | $112,400 | $41,100 | $71,300 |
Source: Public Records
Map
Nearby Homes
Your Personal Tour Guide
Ask me questions while you tour the home.