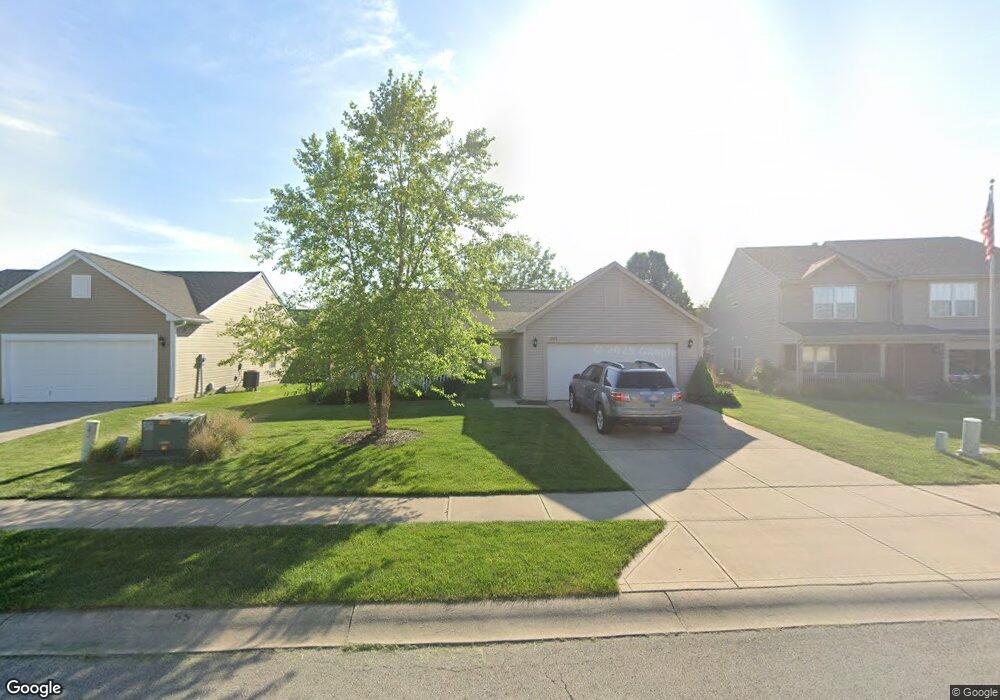
6417 Schell Ln Anderson, IN 46013
Estimated Value: $210,000 - $258,000
3
Beds
2
Baths
1,742
Sq Ft
$137/Sq Ft
Est. Value
About This Home
This home is located at 6417 Schell Ln, Anderson, IN 46013 and is currently estimated at $237,809, approximately $136 per square foot. 6417 Schell Ln is a home located in Madison County with nearby schools including Valley Grove Elementary School, Highland Middle School, and Anderson High School.
Ownership History
Date
Name
Owned For
Owner Type
Purchase Details
Closed on
Apr 20, 2017
Sold by
Mulcahy Cox Trust
Bought by
Mulcahy Cox Trust and Mulcahy Cox Trust
Current Estimated Value
Purchase Details
Closed on
Mar 15, 2013
Sold by
Cox Family Trust
Bought by
Cox Trust
Purchase Details
Closed on
Jul 13, 2012
Sold by
Worline Maggie M
Bought by
Cox Donald W and Cox Maryan E
Purchase Details
Closed on
Jul 3, 2008
Sold by
Arbor Homes Llc
Bought by
Worline Maggie M
Purchase Details
Closed on
May 20, 2008
Sold by
Arbor Investments Llc
Bought by
Arbor Homes Llc
Create a Home Valuation Report for This Property
The Home Valuation Report is an in-depth analysis detailing your home's value as well as a comparison with similar homes in the area
Home Values in the Area
Average Home Value in this Area
Purchase History
| Date | Buyer | Sale Price | Title Company |
|---|---|---|---|
| Mulcahy Cox Trust | -- | -- | |
| Cox Trust | -- | -- | |
| Cox Donald W | -- | None Available | |
| Worline Maggie M | -- | -- | |
| Arbor Homes Llc | -- | -- |
Source: Public Records
Tax History
| Year | Tax Paid | Tax Assessment Tax Assessment Total Assessment is a certain percentage of the fair market value that is determined by local assessors to be the total taxable value of land and additions on the property. | Land | Improvement |
|---|---|---|---|---|
| 2025 | $1,302 | $187,000 | $18,200 | $168,800 |
| 2024 | $1,302 | $168,800 | $18,200 | $150,600 |
| 2023 | $1,276 | $156,100 | $17,300 | $138,800 |
| 2022 | $1,251 | $158,000 | $17,500 | $140,500 |
| 2021 | $1,227 | $145,600 | $17,300 | $128,300 |
| 2020 | $1,203 | $138,100 | $16,500 | $121,600 |
| 2019 | $1,179 | $135,900 | $16,500 | $119,400 |
| 2018 | $1,156 | $126,400 | $16,500 | $109,900 |
| 2017 | $1,208 | $120,800 | $15,800 | $105,000 |
| 2016 | $1,111 | $117,900 | $15,400 | $102,500 |
| 2014 | $1,068 | $112,700 | $14,900 | $97,800 |
| 2013 | $1,068 | $104,700 | $14,900 | $89,800 |
Source: Public Records
Map
Nearby Homes
- 6427 Paramount Springs Dr
- 6604 Robinhood Dr
- 6408 Rosalind Ln
- 0 Twelve Oaks Dr Unit MBR22047252
- 0 Twelve Oaks Dr Unit MBR22082607
- 3244 S 200 E
- 0 S 100 E Unit MBR22031482
- 53 E 53rd St
- 4312 S New Columbus Rd
- 1920 E 49th St
- 1301 E 60th St
- 4912 Atlanta St
- 1905 E 47th St
- 1206 E 53rd St
- 1616 E 47th St
- 1604 E 47th St
- 5479 S 200 E
- 1615 E 44th St
- 2033 Alhambra Ct Unit B
- 5828 Oak Ln
- 6407 Schell Ln
- 6423 Schell Ln
- 6410 Schell Ln
- 6429 Schell Ln
- 6418 Schell Ln
- 6406 Schell Ln
- 6422 Paramount Springs Dr
- 6424 Schell Ln
- 6412 Paramount Springs Dr
- 6428 Paramount Springs Dr
- 6404 Paramount Springs Dr
- 6332 Schell Ln
- 6503 Schell Ln
- 6324 Schell Ln
- 2842 Tribble Rd
- 6502 Paramount Springs Dr
- 6509 Schell Ln
- 2832 Tribble Rd
- 6504 Schell Ln
- 6314 Schell Ln
Your Personal Tour Guide
Ask me questions while you tour the home.