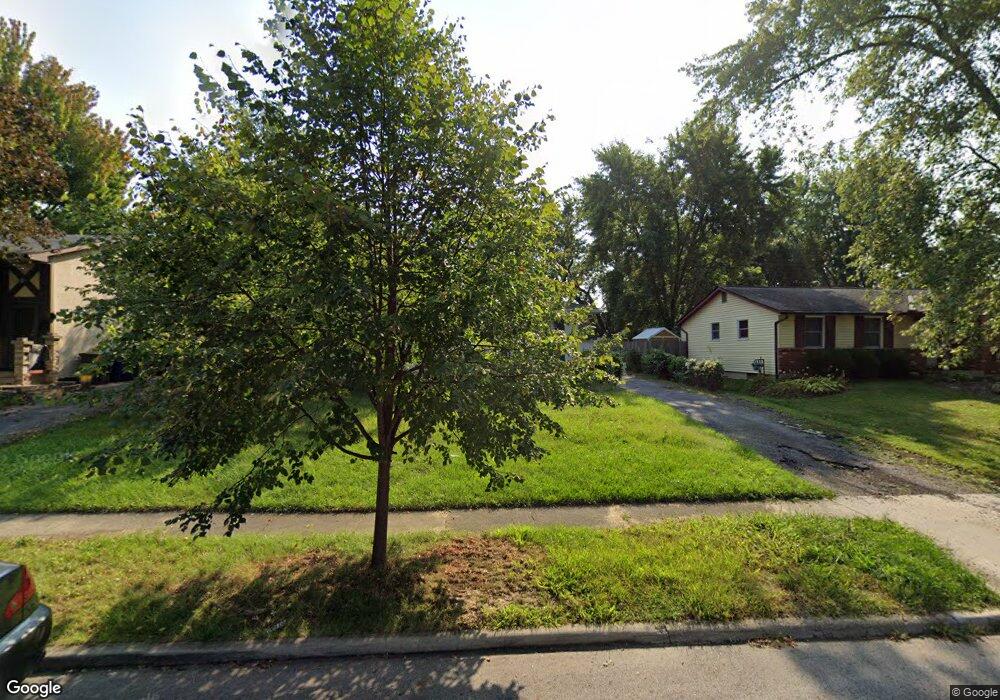
6418 Cardwell Square E Columbus, OH 43229
Devonshire NeighborhoodEstimated Value: $216,000 - $245,807
3
Beds
1
Bath
948
Sq Ft
$247/Sq Ft
Est. Value
About This Home
This home is located at 6418 Cardwell Square E, Columbus, OH 43229 and is currently estimated at $233,952, approximately $246 per square foot. 6418 Cardwell Square E is a home located in Franklin County with nearby schools including Devonshire Alternative Elementary School, Woodward Park Middle School, and Beechcroft High School.
Ownership History
Date
Name
Owned For
Owner Type
Purchase Details
Closed on
Feb 8, 2017
Sold by
Brooks William R
Bought by
Brooks William R and Brooks Nancy J
Current Estimated Value
Home Financials for this Owner
Home Financials are based on the most recent Mortgage that was taken out on this home.
Original Mortgage
$63,500
Outstanding Balance
$52,575
Interest Rate
4.2%
Mortgage Type
New Conventional
Estimated Equity
$181,377
Purchase Details
Closed on
May 9, 2011
Sold by
Federal Home Loan Mortgage Corporation
Bought by
Brooks William R
Purchase Details
Closed on
Mar 18, 2011
Sold by
Columbro Ted C and Columbro Rhonda R
Bought by
Federal Home Loan Mortgage Corp
Purchase Details
Closed on
Nov 30, 1994
Sold by
Hafler Orland W
Bought by
Columbro Ted C and Columbro Rhonda R
Home Financials for this Owner
Home Financials are based on the most recent Mortgage that was taken out on this home.
Original Mortgage
$78,457
Interest Rate
8.91%
Mortgage Type
FHA
Create a Home Valuation Report for This Property
The Home Valuation Report is an in-depth analysis detailing your home's value as well as a comparison with similar homes in the area
Home Values in the Area
Average Home Value in this Area
Purchase History
| Date | Buyer | Sale Price | Title Company |
|---|---|---|---|
| Brooks William R | -- | Great American Title | |
| Brooks William R | $48,900 | None Available | |
| Federal Home Loan Mortgage Corp | $62,000 | None Available | |
| Columbro Ted C | $79,000 | -- |
Source: Public Records
Mortgage History
| Date | Status | Borrower | Loan Amount |
|---|---|---|---|
| Open | Brooks William R | $63,500 | |
| Previous Owner | Columbro Ted C | $78,457 |
Source: Public Records
Tax History Compared to Growth
Tax History
| Year | Tax Paid | Tax Assessment Tax Assessment Total Assessment is a certain percentage of the fair market value that is determined by local assessors to be the total taxable value of land and additions on the property. | Land | Improvement |
|---|---|---|---|---|
| 2024 | $3,319 | $72,420 | $17,500 | $54,920 |
| 2023 | $3,277 | $72,415 | $17,500 | $54,915 |
| 2022 | $2,286 | $43,020 | $12,600 | $30,420 |
| 2021 | $2,290 | $43,020 | $12,600 | $30,420 |
| 2020 | $2,294 | $43,020 | $12,600 | $30,420 |
| 2019 | $2,085 | $33,530 | $10,080 | $23,450 |
| 2018 | $1,917 | $33,530 | $10,080 | $23,450 |
| 2017 | $2,033 | $33,530 | $10,080 | $23,450 |
| 2016 | $3,251 | $29,160 | $7,670 | $21,490 |
| 2015 | $1,804 | $29,160 | $7,670 | $21,490 |
| 2014 | $1,808 | $29,160 | $7,670 | $21,490 |
| 2013 | $990 | $32,375 | $8,505 | $23,870 |
Source: Public Records
Map
Nearby Homes
- 6407 Faircrest Rd
- 6458 Faircrest Rd
- 1421 Bosworth Place
- 1409 Bosworth Place
- 6342 Bellmeadow Dr
- 1268 Kildale Ct
- 1549 Alpine Dr
- 1635 Tendril Ct
- 1294 Clydesdale Ct
- 6407 Skywae Dr
- 1322 Bolenhill Ct
- 1288 Oakfield Dr N
- 6035 Karl Rd
- 6189 Northgap Dr
- 6355 Johnanne St
- 6211 Parkdale Dr
- 1755 Hillandale Ave
- 6245 Sharon Woods Blvd
- 5990 Ambleside Dr
- 6496 Hearthstone Ave
- 6428 Cardwell Square E
- 6412 Cardwell Square E
- 6412 Cardwell Square N
- 6409 Karl Rd
- 6401 Karl Rd
- 6434 Cardwell Square E
- 6415 Cardwell Square E
- 6417 Karl Rd
- 6406 Cardwell Square E
- 6389 Karl Rd
- 6433 Cardwell Square E
- 6425 Karl Rd
- 1471 Cardwell Square S
- 6381 Karl Rd
- 1464 Cardwell Square S
- 6440 Cardwell Square E
- 1464 Cardwell Square N
- 1465 Cardwell Square N
- 1465 Cardwell Square S
- 6433 Karl Rd