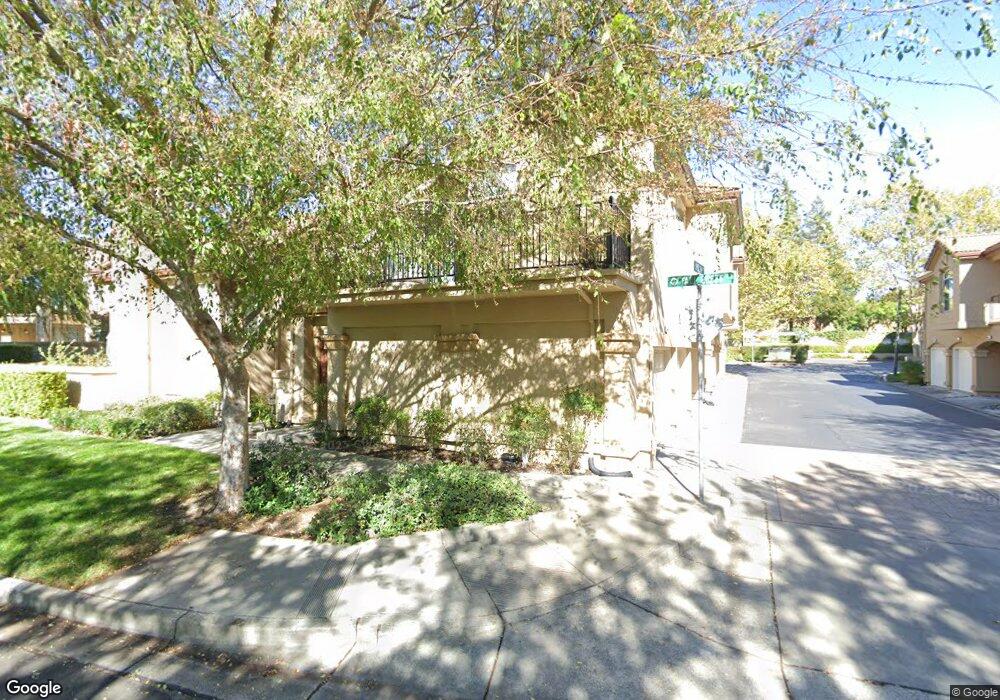
6419 Dijon Way Unit 68 Dublin, CA 94568
Estimated Value: $746,000 - $834,000
3
Beds
2
Baths
1,260
Sq Ft
$627/Sq Ft
Est. Value
About This Home
This home is located at 6419 Dijon Way Unit 68, Dublin, CA 94568 and is currently estimated at $790,512, approximately $627 per square foot. 6419 Dijon Way Unit 68 is a home located in Alameda County with nearby schools including Frederiksen Elementary School, Wells Middle School, and Dublin High School.
Ownership History
Date
Name
Owned For
Owner Type
Purchase Details
Closed on
Aug 25, 2009
Sold by
Camicia Eugene L
Bought by
Camicia Joele M
Current Estimated Value
Home Financials for this Owner
Home Financials are based on the most recent Mortgage that was taken out on this home.
Original Mortgage
$68,000
Interest Rate
5.09%
Mortgage Type
New Conventional
Purchase Details
Closed on
Sep 30, 1998
Sold by
Camicia Mildred M
Bought by
Camicia Eugene L
Home Financials for this Owner
Home Financials are based on the most recent Mortgage that was taken out on this home.
Original Mortgage
$53,500
Interest Rate
6.88%
Purchase Details
Closed on
Oct 10, 1996
Sold by
Malatesta Keith A and Malatesta Albert A
Bought by
Craig Christopher Alan and Craig Bruce
Home Financials for this Owner
Home Financials are based on the most recent Mortgage that was taken out on this home.
Original Mortgage
$143,200
Interest Rate
8.3%
Mortgage Type
Balloon
Create a Home Valuation Report for This Property
The Home Valuation Report is an in-depth analysis detailing your home's value as well as a comparison with similar homes in the area
Home Values in the Area
Average Home Value in this Area
Purchase History
| Date | Buyer | Sale Price | Title Company |
|---|---|---|---|
| Camicia Joele M | $34,000 | North American Title Company | |
| Camicia Eugene L | -- | North American Title Co | |
| Camicia Joele M | $222,000 | North American Title Co | |
| Craig Christopher Alan | $179,000 | Old Republic Title Company | |
| Craig Allen Bruce | -- | Old Republic Title Company |
Source: Public Records
Mortgage History
| Date | Status | Borrower | Loan Amount |
|---|---|---|---|
| Closed | Camicia Joele M | $68,000 | |
| Previous Owner | Camicia Joele M | $53,500 | |
| Previous Owner | Craig Christopher Alan | $143,200 |
Source: Public Records
Tax History Compared to Growth
Tax History
| Year | Tax Paid | Tax Assessment Tax Assessment Total Assessment is a certain percentage of the fair market value that is determined by local assessors to be the total taxable value of land and additions on the property. | Land | Improvement |
|---|---|---|---|---|
| 2025 | $4,903 | $341,011 | $104,403 | $243,608 |
| 2024 | $4,903 | $334,188 | $102,356 | $238,832 |
| 2023 | $4,842 | $334,500 | $100,350 | $234,150 |
| 2022 | $4,755 | $320,941 | $98,382 | $229,559 |
| 2021 | $4,692 | $314,513 | $96,454 | $225,059 |
| 2020 | $6,218 | $318,216 | $95,465 | $222,751 |
| 2019 | $6,219 | $311,978 | $93,593 | $218,385 |
| 2018 | $6,106 | $305,861 | $91,758 | $214,103 |
| 2017 | $6,072 | $299,865 | $89,959 | $209,906 |
| 2016 | $5,708 | $293,987 | $88,196 | $205,791 |
| 2015 | $5,580 | $289,571 | $86,871 | $202,700 |
| 2014 | $3,765 | $283,900 | $85,170 | $198,730 |
Source: Public Records
Map
Nearby Homes
- 7813 Shady Creek Rd
- 8043 Crossridge Rd
- 2141 Bent Creek Dr
- 7120 Cross Creek Cir Unit D
- 6746 Sapphire St
- 7092 N Mariposa Ct
- 7653 Turquoise St
- 7063 Dublin Meadows St Unit H
- 7148 Dublin Meadows St Unit E
- 6983 Alamo Creek Trail
- 7054 Dublin Meadows St Unit D
- 9054 Craydon Cir
- 1725 SW Wren
- 9048 Craydon Cir
- 9104 Craydon Cir
- 9014 Craydon Cir
- 7020 Stagecoach Rd Unit A
- 8351 Mulberry Place
- 174 Dogwood Place
- 6630 S Mariposa Ln
- 6421 Dijon Way Unit 69
- 6415 Dijon Way Unit 66
- 6417 Dijon Way
- 6413 Dijon Way Unit 65
- 6411 Dijon Way Unit 64
- 6420 Dijon Way
- 6414 Dijon Way
- 6412 Dijon Way Unit 75
- 6416 Dijon Way
- 6418 Dijon Way
- 6422 Dijon Way
- 7642 Tuscany Dr
- 7640 Tuscany Dr
- 7644 Tuscany Dr
- 7648 Tuscany Dr Unit 59
- 7650 Tuscany Dr Unit 58
- 7672 Tuscany Dr
- 7674 Tuscany Dr
- 7670 Tuscany Dr
- 7635 Tuscany Dr Unit 89