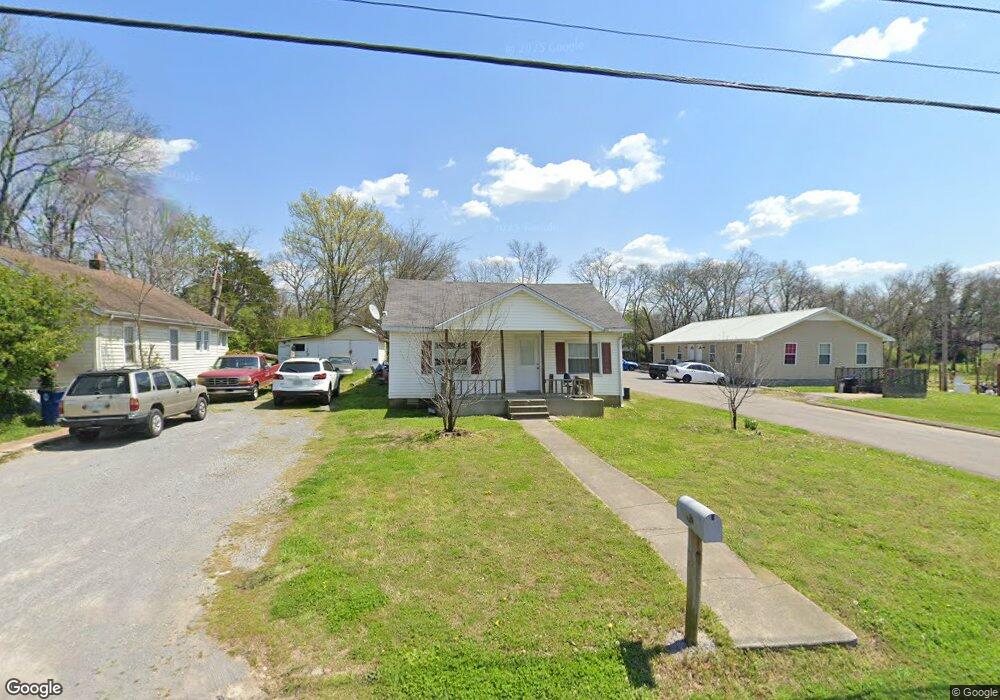
642 Deery St Shelbyville, TN 37160
Estimated Value: $165,000 - $219,000
--
Bed
2
Baths
1,074
Sq Ft
$180/Sq Ft
Est. Value
About This Home
This home is located at 642 Deery St, Shelbyville, TN 37160 and is currently estimated at $192,954, approximately $179 per square foot. 642 Deery St is a home located in Bedford County with nearby schools including Harris Middle School, Victory Baptist Academy, and Christian Chapel Academy.
Ownership History
Date
Name
Owned For
Owner Type
Purchase Details
Closed on
Dec 19, 2024
Sold by
Jackson John K and Revoc Norma
Bought by
Mcgee Brad and Fisher Brett
Current Estimated Value
Purchase Details
Closed on
Oct 16, 2006
Sold by
Glover Carl D
Bought by
Jackson John Keith
Purchase Details
Closed on
Jul 6, 2006
Sold by
Collins Kathy
Bought by
Glover Carl D
Purchase Details
Closed on
Sep 30, 2005
Sold by
Perry Craig R
Bought by
Collins Kathy
Home Financials for this Owner
Home Financials are based on the most recent Mortgage that was taken out on this home.
Original Mortgage
$25,873
Interest Rate
5.66%
Purchase Details
Closed on
Jul 2, 1996
Sold by
Perry Craig
Bought by
Perry Craig
Purchase Details
Closed on
Nov 30, 1992
Bought by
Perry Craig and Perry Lisa
Purchase Details
Closed on
Jun 12, 1987
Bought by
Perry Wayne and Craig Perry
Purchase Details
Closed on
Sep 19, 1986
Bought by
Stallings John C
Create a Home Valuation Report for This Property
The Home Valuation Report is an in-depth analysis detailing your home's value as well as a comparison with similar homes in the area
Home Values in the Area
Average Home Value in this Area
Purchase History
| Date | Buyer | Sale Price | Title Company |
|---|---|---|---|
| Mcgee Brad | $2,400,000 | Trinity Title | |
| Mcgee Brad | $2,400,000 | Trinity Title | |
| Jackson John Keith | $45,000 | -- | |
| Glover Carl D | $38,000 | -- | |
| Collins Kathy | $25,000 | -- | |
| Perry Craig | -- | -- | |
| Perry Craig | -- | -- | |
| Perry Wayne | $20,000 | -- | |
| Stallings John C | -- | -- |
Source: Public Records
Mortgage History
| Date | Status | Borrower | Loan Amount |
|---|---|---|---|
| Previous Owner | Stallings John C | $25,873 |
Source: Public Records
Tax History Compared to Growth
Tax History
| Year | Tax Paid | Tax Assessment Tax Assessment Total Assessment is a certain percentage of the fair market value that is determined by local assessors to be the total taxable value of land and additions on the property. | Land | Improvement |
|---|---|---|---|---|
| 2025 | -- | $32,625 | $0 | $0 |
| 2024 | -- | $32,625 | $3,000 | $29,625 |
| 2023 | $1,242 | $32,625 | $3,000 | $29,625 |
| 2022 | $1,278 | $32,625 | $3,000 | $29,625 |
| 2021 | $1,160 | $32,625 | $3,000 | $29,625 |
| 2020 | $563 | $32,625 | $3,000 | $29,625 |
| 2019 | $563 | $12,700 | $1,500 | $11,200 |
| 2018 | $550 | $12,700 | $1,500 | $11,200 |
| 2017 | $550 | $12,700 | $1,500 | $11,200 |
| 2016 | $545 | $12,700 | $1,500 | $11,200 |
| 2015 | $545 | $12,700 | $1,500 | $11,200 |
| 2014 | $525 | $13,404 | $0 | $0 |
Source: Public Records
Map
Nearby Homes
- 636 Deery St
- 639 Deery St
- 724 Alton Ave
- 703 Deery St
- 713 King Ave
- 714 King Ave
- 527 Deery St
- 0 Hilltop Rd Unit RTC2897754
- 0 Hilltop Rd Unit RTC3001632
- 112 E Cedar St
- 464 Whitthorne St
- 1017 Fairfield Pike
- 216 Celebration St
- 610 Sundance St
- 627 E Lane St
- 631 E Lane St
- 1000 Woodbury St
- 178 Lucas Rd
- 0 E Depot St
- 117 Blue Ribbon Pkwy