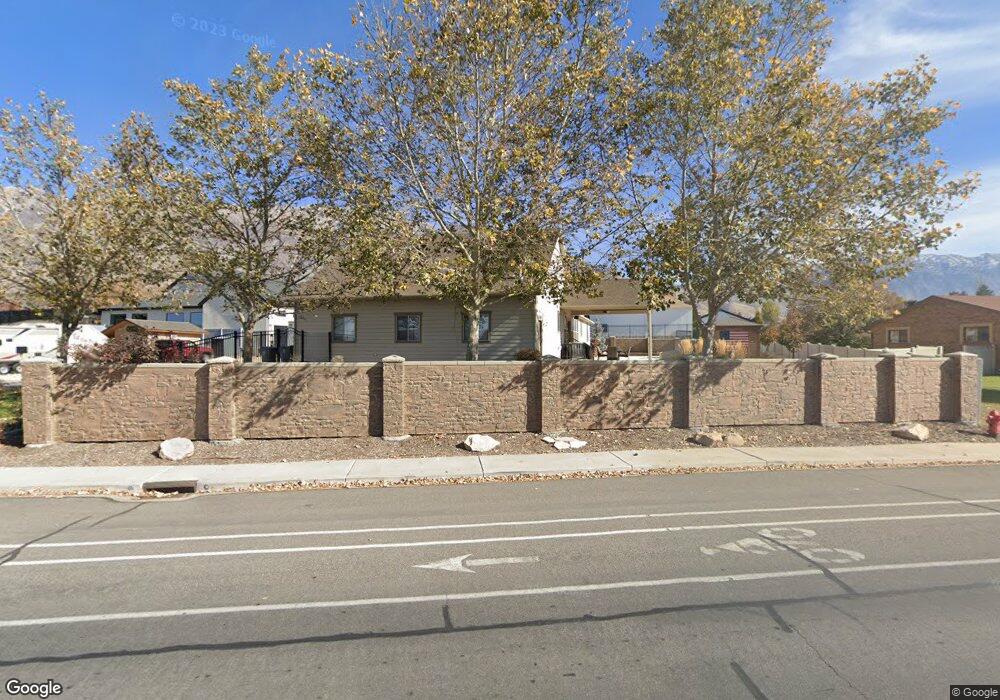
642 N Locust Ave Lindon, UT 84042
Estimated Value: $837,000 - $1,130,516
4
Beds
4
Baths
4,004
Sq Ft
$234/Sq Ft
Est. Value
About This Home
This home is located at 642 N Locust Ave, Lindon, UT 84042 and is currently estimated at $938,505, approximately $234 per square foot. 642 N Locust Ave is a home located in Utah County with nearby schools including Lindon Elementary School, Oak Canyon Junior High School, and Pleasant Grove High School.
Ownership History
Date
Name
Owned For
Owner Type
Purchase Details
Closed on
Mar 24, 2016
Sold by
Flores Elita L and Flores Elita L
Bought by
Ruiz Orlando and Ruiz Carey
Current Estimated Value
Home Financials for this Owner
Home Financials are based on the most recent Mortgage that was taken out on this home.
Original Mortgage
$412,000
Interest Rate
3.6%
Mortgage Type
New Conventional
Purchase Details
Closed on
Aug 27, 2015
Sold by
Fryer Colby C and Fryer Sara Jean
Bought by
Flores Elita
Purchase Details
Closed on
Aug 22, 2006
Sold by
Vanfryer Creig and Fryer Mary Lue
Bought by
Fryer Colby C and Fryer Sara Jean
Home Financials for this Owner
Home Financials are based on the most recent Mortgage that was taken out on this home.
Original Mortgage
$274,000
Interest Rate
6.76%
Mortgage Type
Construction
Create a Home Valuation Report for This Property
The Home Valuation Report is an in-depth analysis detailing your home's value as well as a comparison with similar homes in the area
Home Values in the Area
Average Home Value in this Area
Purchase History
| Date | Buyer | Sale Price | Title Company |
|---|---|---|---|
| Ruiz Orlando | -- | Greenbrier Ttl Ins Agcy Inc | |
| Flores Elita | -- | Bartlett Title Ins Agency | |
| Fryer Colby C | -- | Inwest Title Services Inc |
Source: Public Records
Mortgage History
| Date | Status | Borrower | Loan Amount |
|---|---|---|---|
| Previous Owner | Ruiz Orlando | $412,000 | |
| Previous Owner | Fryer Colby C | $274,000 |
Source: Public Records
Tax History
| Year | Tax Paid | Tax Assessment Tax Assessment Total Assessment is a certain percentage of the fair market value that is determined by local assessors to be the total taxable value of land and additions on the property. | Land | Improvement |
|---|---|---|---|---|
| 2025 | $3,925 | $548,955 | -- | -- |
| 2024 | $3,925 | $483,890 | $0 | $0 |
| 2023 | $3,524 | $466,565 | $0 | $0 |
| 2022 | $3,811 | $487,465 | $0 | $0 |
| 2021 | $3,303 | $637,000 | $287,100 | $349,900 |
| 2020 | $3,146 | $597,400 | $261,000 | $336,400 |
| 2019 | $2,775 | $549,600 | $213,200 | $336,400 |
| 2018 | $2,803 | $523,500 | $187,100 | $336,400 |
| 2017 | $2,762 | $276,540 | $0 | $0 |
| 2016 | $2,554 | $236,555 | $0 | $0 |
Source: Public Records
Map
Nearby Homes
- 355 W 600 N
- 517 N 80 W
- 1135 E 900 S
- 696 S Locust Ave
- 461 W 490 N
- 465 W 490 N
- 469 W 490 N
- 793 E Orchard Dr
- 1172 E Murdock Dr
- 494 E Apple Blossom Dr
- 308 E 750 N
- 130 E 800 N
- 190 E 800 N Unit 4
- 170 E 800 N Unit 3
- 150 E 800 N Unit 2
- 435 E 790 S Unit 8
- 1176 E 470 S
- 1515 E 200 S
- 897 E 200 S Unit 10
- 180 S 950 E
Your Personal Tour Guide
Ask me questions while you tour the home.