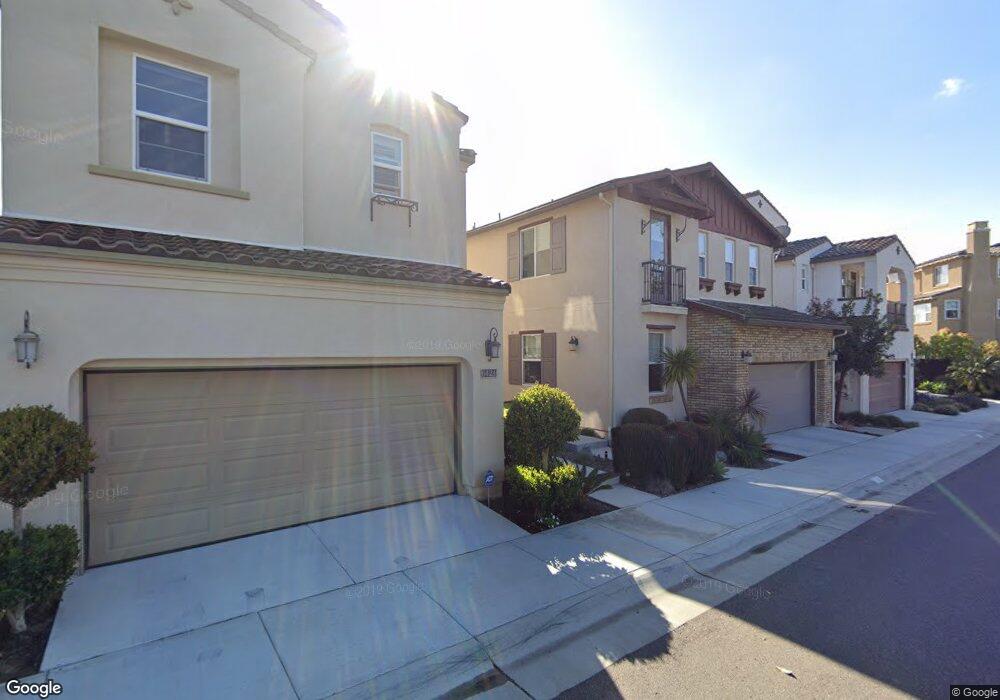
6420 Jasper Way Unit 26 Carlsbad, CA 92009
La Costa NeighborhoodEstimated Value: $1,444,000 - $1,610,000
3
Beds
4
Baths
1,989
Sq Ft
$762/Sq Ft
Est. Value
About This Home
This home is located at 6420 Jasper Way Unit 26, Carlsbad, CA 92009 and is currently estimated at $1,516,276, approximately $762 per square foot. 6420 Jasper Way Unit 26 is a home located in San Diego County with nearby schools including Poinsettia Elementary School, Aviara Oaks Middle, and Sage Creek High.
Ownership History
Date
Name
Owned For
Owner Type
Purchase Details
Closed on
May 27, 2021
Sold by
Fisher Kenneth A
Bought by
Kerl Brian D and Cohenour Kerl Sally
Current Estimated Value
Home Financials for this Owner
Home Financials are based on the most recent Mortgage that was taken out on this home.
Original Mortgage
$1,120,000
Outstanding Balance
$1,014,020
Interest Rate
2.9%
Mortgage Type
New Conventional
Estimated Equity
$502,256
Purchase Details
Closed on
Jul 16, 2010
Sold by
Lc Greens 13 Llc
Bought by
Fisher Kenenth A
Home Financials for this Owner
Home Financials are based on the most recent Mortgage that was taken out on this home.
Original Mortgage
$482,267
Interest Rate
4.28%
Mortgage Type
New Conventional
Create a Home Valuation Report for This Property
The Home Valuation Report is an in-depth analysis detailing your home's value as well as a comparison with similar homes in the area
Home Values in the Area
Average Home Value in this Area
Purchase History
| Date | Buyer | Sale Price | Title Company |
|---|---|---|---|
| Kerl Brian D | $1,275,000 | First American Title Company | |
| Fisher Kenenth A | $603,000 | Chicago Title Company |
Source: Public Records
Mortgage History
| Date | Status | Borrower | Loan Amount |
|---|---|---|---|
| Open | Kerl Brian D | $1,120,000 | |
| Previous Owner | Fisher Kenenth A | $482,267 |
Source: Public Records
Tax History
| Year | Tax Paid | Tax Assessment Tax Assessment Total Assessment is a certain percentage of the fair market value that is determined by local assessors to be the total taxable value of land and additions on the property. | Land | Improvement |
|---|---|---|---|---|
| 2025 | $15,665 | $1,380,099 | $1,039,134 | $340,965 |
| 2024 | $15,665 | $1,353,039 | $1,018,759 | $334,280 |
| 2023 | $15,589 | $1,326,510 | $998,784 | $327,726 |
| 2022 | $15,367 | $1,300,500 | $979,200 | $321,300 |
| 2021 | $9,181 | $713,509 | $384,669 | $328,840 |
| 2020 | $9,126 | $706,194 | $380,725 | $325,469 |
| 2019 | $8,983 | $692,348 | $373,260 | $319,088 |
| 2018 | $8,659 | $678,774 | $365,942 | $312,832 |
| 2017 | $8,536 | $665,466 | $358,767 | $306,699 |
| 2016 | $8,246 | $652,419 | $351,733 | $300,686 |
| 2015 | $8,222 | $642,620 | $346,450 | $296,170 |
| 2014 | $8,101 | $630,033 | $339,664 | $290,369 |
Source: Public Records
Map
Nearby Homes
- 6626 Halite Place
- 6675 Agave Cir
- 6907 Quail Place Unit F
- 6901 Quail Place Unit A
- 1634 Fairlead Ave
- 1747 Oriole Ct
- 6956 Sandpiper Place
- 6934 Feldspar Place
- 6903 Goldstone Rd
- 6433 La Paloma St
- 2266 Aventurine Place
- 1913 Alga Rd Unit A
- 1933 Alga Rd Unit C
- 6140 Colt Place Unit 104
- 2518 Unicornio St
- 7101 Mimosa Dr
- 7026 Estrella de Mar Rd
- 1915 Estrella de Mar Ct Unit C
- 1915 Estrella de Mar Ct Unit A
- 6429 La Vanco Ct
- 2410 Copper Way Unit 21
- 6436 Jasper Way Unit LOT 22
- 6432 Jasper Way Unit 23
- 6428 Jasper Way Unit 24
- 6412 Jasper Way Unit 28
- 6416 Jasper Way Unit 27
- 6428 Jasper Way
- 6420 Jasper Way
- 6412 Jasper Way
- 6424 Jasper Way Unit 25
- 6424 Jasper Way
- 2410 Copper Way
- 6436 Jasper Way
- 2414 Copper Way Unit 20
- 2414 Copper Way
- 2418 Copper Way Unit 19
- 6408 Jasper Way Unit 29
- 6404 Jasper Way Unit 31
- 6404 Jasper Way Unit 30
- 2422 Copper Way Unit 18
Your Personal Tour Guide
Ask me questions while you tour the home.