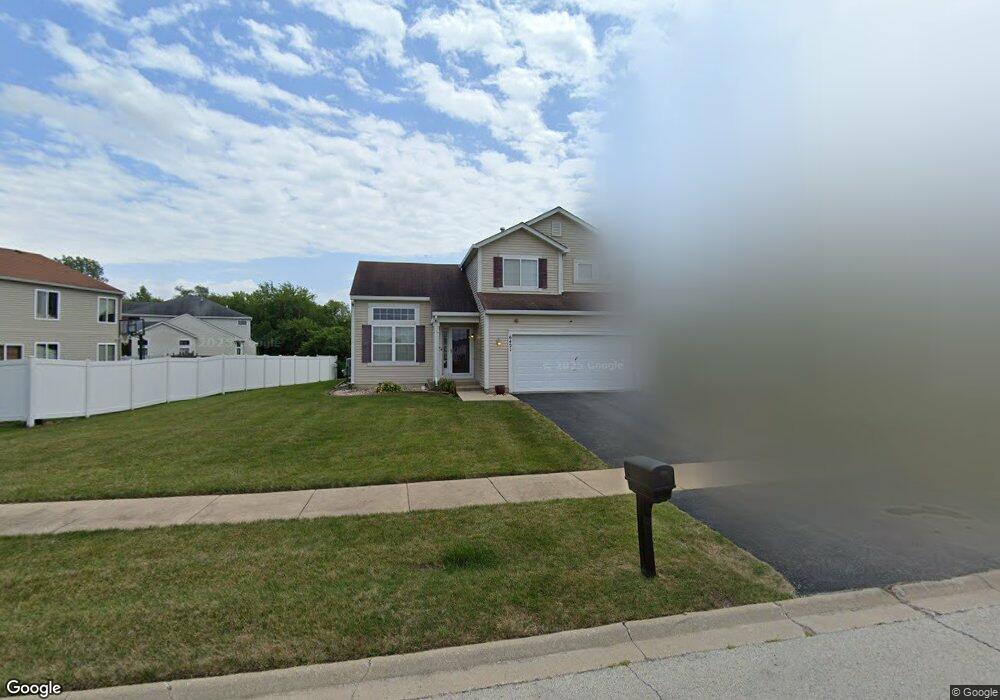
6421 Hummingbird Ln Matteson, IL 60443
West Matteson NeighborhoodEstimated Value: $349,358 - $365,000
4
Beds
3
Baths
2,209
Sq Ft
$160/Sq Ft
Est. Value
About This Home
This home is located at 6421 Hummingbird Ln, Matteson, IL 60443 and is currently estimated at $354,090, approximately $160 per square foot. 6421 Hummingbird Ln is a home located in Cook County with nearby schools including Colin Powell Middle School and Southland College Prep.
Ownership History
Date
Name
Owned For
Owner Type
Purchase Details
Closed on
Nov 25, 2024
Sold by
Quarles Sharon
Bought by
Mcdonald-Nnamdi Artisha and Udeagu Victor N
Current Estimated Value
Home Financials for this Owner
Home Financials are based on the most recent Mortgage that was taken out on this home.
Original Mortgage
$330,000
Outstanding Balance
$326,550
Interest Rate
6.38%
Mortgage Type
VA
Estimated Equity
$27,540
Purchase Details
Closed on
May 7, 2012
Sold by
Massey Shandell
Bought by
Quarles Sharon
Home Financials for this Owner
Home Financials are based on the most recent Mortgage that was taken out on this home.
Original Mortgage
$127,645
Interest Rate
3.99%
Mortgage Type
FHA
Purchase Details
Closed on
Nov 28, 2011
Sold by
Massey Shandell and Massey Shon
Bought by
Massey Shandell
Purchase Details
Closed on
Aug 17, 2007
Sold by
Mbc V Llc
Bought by
Montalbano Builders Inc
Home Financials for this Owner
Home Financials are based on the most recent Mortgage that was taken out on this home.
Original Mortgage
$250,445
Interest Rate
6.77%
Mortgage Type
Unknown
Create a Home Valuation Report for This Property
The Home Valuation Report is an in-depth analysis detailing your home's value as well as a comparison with similar homes in the area
Home Values in the Area
Average Home Value in this Area
Purchase History
| Date | Buyer | Sale Price | Title Company |
|---|---|---|---|
| Mcdonald-Nnamdi Artisha | $330,000 | First American Title | |
| Mcdonald-Nnamdi Artisha | $330,000 | First American Title | |
| Quarles Sharon | $130,000 | Git | |
| Massey Shandell | -- | None Available | |
| Montalbano Builders Inc | -- | Ctic | |
| Massey Shandell | $250,500 | Cti |
Source: Public Records
Mortgage History
| Date | Status | Borrower | Loan Amount |
|---|---|---|---|
| Open | Mcdonald-Nnamdi Artisha | $330,000 | |
| Closed | Mcdonald-Nnamdi Artisha | $330,000 | |
| Previous Owner | Quarles Sharon | $127,645 | |
| Previous Owner | Massey Shandell | $250,445 |
Source: Public Records
Tax History Compared to Growth
Tax History
| Year | Tax Paid | Tax Assessment Tax Assessment Total Assessment is a certain percentage of the fair market value that is determined by local assessors to be the total taxable value of land and additions on the property. | Land | Improvement |
|---|---|---|---|---|
| 2024 | $11,482 | $31,014 | $17,109 | $13,905 |
| 2023 | $7,370 | $31,014 | $17,109 | $13,905 |
| 2022 | $7,370 | $17,187 | $5,368 | $11,819 |
| 2021 | $7,487 | $17,185 | $5,367 | $11,818 |
| 2020 | $7,354 | $17,185 | $5,367 | $11,818 |
| 2019 | $9,576 | $20,956 | $5,032 | $15,924 |
| 2018 | $9,434 | $20,956 | $5,032 | $15,924 |
| 2017 | $11,334 | $21,649 | $5,032 | $16,617 |
| 2016 | $9,888 | $19,108 | $4,696 | $14,412 |
| 2015 | $9,710 | $19,108 | $4,696 | $14,412 |
| 2014 | $9,446 | $19,108 | $4,696 | $14,412 |
| 2013 | $9,571 | $20,804 | $4,696 | $16,108 |
Source: Public Records
Map
Nearby Homes
- 6508 Fawn Ct
- 6409 Old Plank Blvd
- 0 Ridgeland Ave
- 126 Knollwood Cir
- 66 Candlegate Cir
- 123 Knollwood Cir
- 62 Brushwood Dr
- 51 Brushwood Dr
- 6520 Bridle Path Dr
- 25 Hearthside Dr
- 6608 Pasture Side Trail
- 6529 Blue Sky Ln
- 6700 Old Plank Blvd
- 21218 Shannon Ave
- 6423 Gray Hawk Dr Unit 2716
- 21143 Gray Hawk Dr Unit 2554
- 65 Crocus Ln
- 278 Blackthorn Rd
- 317 Pleasant Terrace
- 513 Prairie Rd
- 6421 Hummingbird Ln
- 6409 Hummingbird Ct
- 6407 Hummingbird Ct
- 6407 Hummingbird Ct
- 6429 Hummingbird Ln
- 6424 Hummingbird Ln
- 6420 Hummingbird Ln
- 6428 Hummingbird Ln
- 6433 Hummingbird Ln
- 6416 Hummingbird Ln
- 6405 Hummingbird Ct
- 6412 Hummingbird Ln
- 6500 Fawn Ct
- 6501 Hummingbird Ln
- 6408 Hummingbird Ln
- 6502 Fawn Ct
- 6401 Hummingbird Ct
- 6403 Hummingbird Ct
- 102 Candlegate Cir
- 6404 Hummingbird Ln