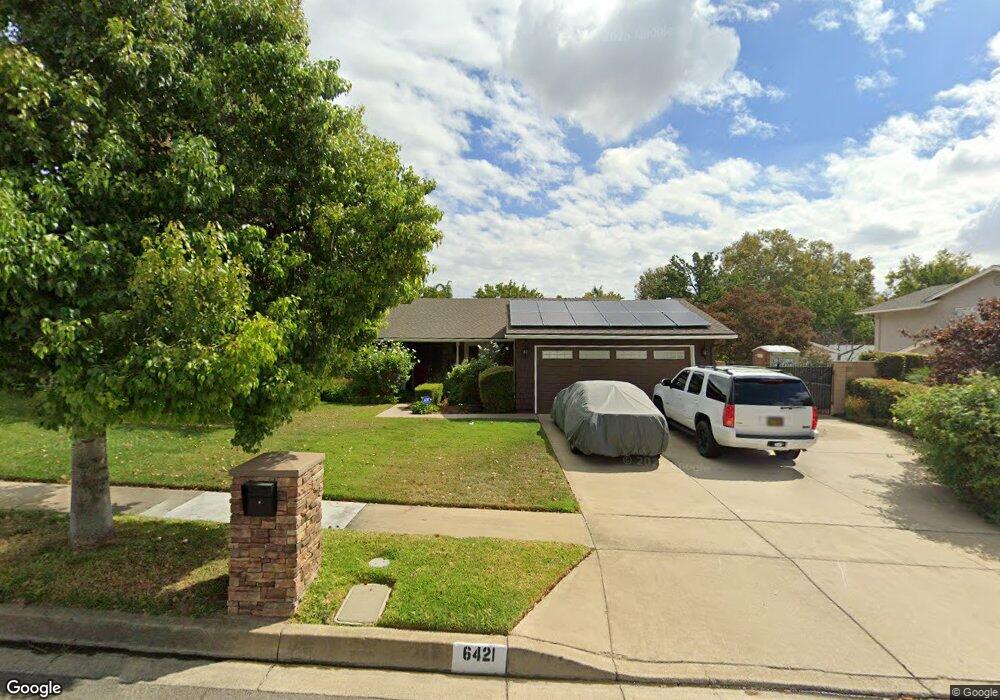
6421 Jadeite Ave Rancho Cucamonga, CA 91737
Estimated Value: $805,612 - $911,000
3
Beds
2
Baths
1,935
Sq Ft
$443/Sq Ft
Est. Value
About This Home
This home is located at 6421 Jadeite Ave, Rancho Cucamonga, CA 91737 and is currently estimated at $857,653, approximately $443 per square foot. 6421 Jadeite Ave is a home located in San Bernardino County with nearby schools including Carnelian Elementary, Alta Loma Junior High, and Alta Loma High.
Ownership History
Date
Name
Owned For
Owner Type
Purchase Details
Closed on
Sep 1, 2010
Sold by
Pegram Vista Vivian
Bought by
Hutt Dion and Hutt Pamela
Current Estimated Value
Home Financials for this Owner
Home Financials are based on the most recent Mortgage that was taken out on this home.
Original Mortgage
$335,482
Outstanding Balance
$224,989
Interest Rate
4.75%
Mortgage Type
FHA
Estimated Equity
$632,664
Purchase Details
Closed on
May 6, 2005
Sold by
Pegram Vista Vivian and Thomas Franklin Sr & Vista Viv
Bought by
Pegram Vista Vivian
Home Financials for this Owner
Home Financials are based on the most recent Mortgage that was taken out on this home.
Original Mortgage
$469,342
Interest Rate
4.83%
Mortgage Type
Reverse Mortgage Home Equity Conversion Mortgage
Purchase Details
Closed on
Apr 16, 1996
Sold by
Pegram Thomas Franklin and Pegram Vista Vivian
Bought by
Pegram Thomas Franklin and Pegram Vista Vivian
Create a Home Valuation Report for This Property
The Home Valuation Report is an in-depth analysis detailing your home's value as well as a comparison with similar homes in the area
Home Values in the Area
Average Home Value in this Area
Purchase History
| Date | Buyer | Sale Price | Title Company |
|---|---|---|---|
| Hutt Dion | $340,000 | Ticor Title Company | |
| Pegram Vista Vivian | -- | Alliance Title Company | |
| Pegram Thomas Franklin | -- | -- |
Source: Public Records
Mortgage History
| Date | Status | Borrower | Loan Amount |
|---|---|---|---|
| Open | Hutt Dion | $335,482 | |
| Previous Owner | Pegram Vista Vivian | $469,342 |
Source: Public Records
Tax History Compared to Growth
Tax History
| Year | Tax Paid | Tax Assessment Tax Assessment Total Assessment is a certain percentage of the fair market value that is determined by local assessors to be the total taxable value of land and additions on the property. | Land | Improvement |
|---|---|---|---|---|
| 2025 | $4,931 | $461,976 | $152,460 | $309,516 |
| 2024 | $4,931 | $452,918 | $149,471 | $303,447 |
| 2023 | $4,819 | $444,037 | $146,540 | $297,497 |
| 2022 | $4,805 | $435,331 | $143,667 | $291,664 |
| 2021 | $4,802 | $426,795 | $140,850 | $285,945 |
| 2020 | $4,604 | $422,419 | $139,406 | $283,013 |
| 2019 | $4,655 | $414,137 | $136,673 | $277,464 |
| 2018 | $4,550 | $406,017 | $133,993 | $272,024 |
| 2017 | $4,341 | $398,056 | $131,366 | $266,690 |
| 2016 | $4,221 | $390,251 | $128,790 | $261,461 |
| 2015 | $4,194 | $384,389 | $126,855 | $257,534 |
| 2014 | $4,074 | $376,859 | $124,370 | $252,489 |
Source: Public Records
Map
Nearby Homes
- 9757 Balaton St
- 9504 Lemon Ave
- 6360 Calle Hermoso
- 6155 Klusman Ave
- 6765 Jadeite Ave
- 6740 London Ave
- 9740 Woodleaf Dr
- 6055 Amethyst Ave
- 6742 Meriwether Ct
- 9513 Sunflower St
- 10141 Orange St
- 10123 Finch Ave
- 6600 Montresor Place
- 6880 Archibald Ave Unit 114
- 6880 Archibald Ave Unit 27
- 6880 Archibald Ave Unit 40
- 9320 Isaac Lord Dr
- 9179 Lemon Ave
- 10121 Banyan St
- 6946 Archibald Ave
- 6435 Jadeite Ave
- 6407 Jadeite Ave
- 6455 Jadeite Ave
- 6393 Jadeite Ave
- 6418 Jadeite Ave
- 6430 Jadeite Ave
- 6406 Jadeite Ave
- 6446 Caledon Place
- 6404 Caledon Place
- 6412 Caledon Place
- 6448 Jadeite Ave
- 9716 Caldaro St
- 6452 Caledon Place
- 6400 Caledon Place
- 6394 Jadeite Ave
- 6471 Jadeite Ave
- 6379 Jadeite Ave
- 6464 Caledon Place
- 6390 Caledon Place
- 9724 Caldaro St