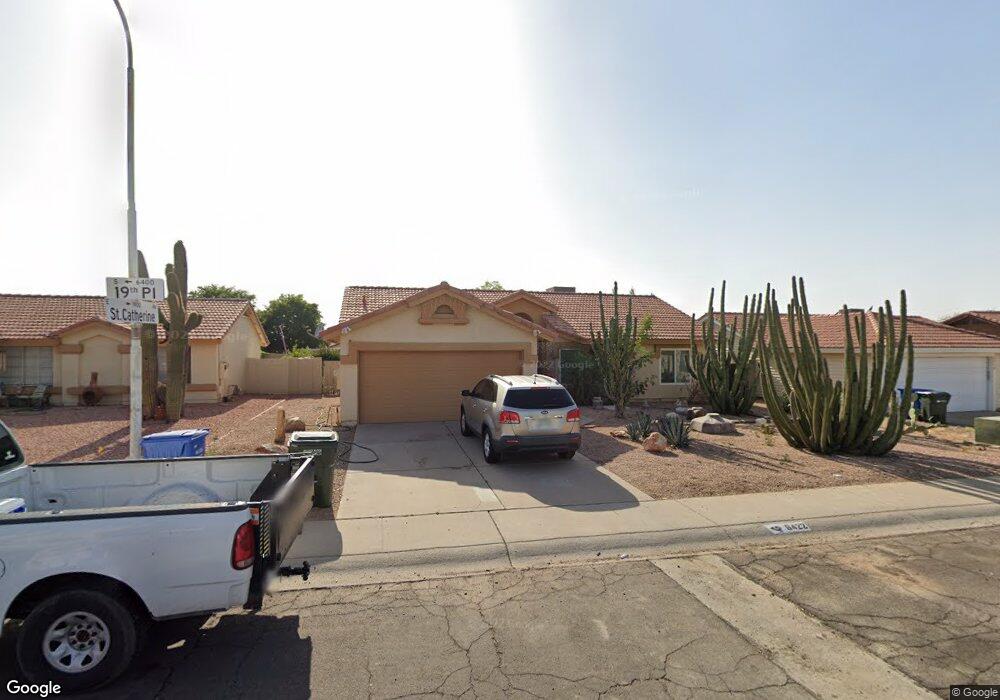
6422 S 19th Place Phoenix, AZ 85042
South Mountain NeighborhoodEstimated Value: $322,251 - $377,000
--
Bed
2
Baths
1,309
Sq Ft
$270/Sq Ft
Est. Value
About This Home
This home is located at 6422 S 19th Place, Phoenix, AZ 85042 and is currently estimated at $353,313, approximately $269 per square foot. 6422 S 19th Place is a home located in Maricopa County with nearby schools including T G Barr School, South Mountain High School, and Phoenix Coding Academy.
Ownership History
Date
Name
Owned For
Owner Type
Purchase Details
Closed on
Jul 18, 2018
Sold by
Boirum Boirum D and Boirum Sonia
Bought by
Flores Derek and Camacho Karina
Current Estimated Value
Home Financials for this Owner
Home Financials are based on the most recent Mortgage that was taken out on this home.
Original Mortgage
$195,000
Outstanding Balance
$169,370
Interest Rate
4.6%
Mortgage Type
VA
Estimated Equity
$183,943
Purchase Details
Closed on
Mar 5, 2009
Sold by
Morales Alfredo Enriquez and Enriquez Luis
Bought by
Boirum D Mark and Boirum Sonia
Purchase Details
Closed on
Jan 17, 2001
Sold by
Morales Alfredo Enriquez
Bought by
Morales Alfredo Enriquez and Enriquez Luis
Purchase Details
Closed on
Jan 7, 1999
Sold by
Enriquez Luis A and Enriquez Sandra M
Bought by
Morales Alfredo Enriquez
Create a Home Valuation Report for This Property
The Home Valuation Report is an in-depth analysis detailing your home's value as well as a comparison with similar homes in the area
Home Values in the Area
Average Home Value in this Area
Purchase History
| Date | Buyer | Sale Price | Title Company |
|---|---|---|---|
| Flores Derek | $195,000 | Old Republic Title Agency | |
| Boirum D Mark | $144,500 | Chicago Title | |
| Morales Alfredo Enriquez | -- | Capital Title Agency | |
| Morales Alfredo Enriquez | $66,747 | Ati Title Agency |
Source: Public Records
Mortgage History
| Date | Status | Borrower | Loan Amount |
|---|---|---|---|
| Open | Flores Derek | $195,000 |
Source: Public Records
Tax History Compared to Growth
Tax History
| Year | Tax Paid | Tax Assessment Tax Assessment Total Assessment is a certain percentage of the fair market value that is determined by local assessors to be the total taxable value of land and additions on the property. | Land | Improvement |
|---|---|---|---|---|
| 2025 | $1,177 | $8,711 | -- | -- |
| 2024 | $1,112 | $8,296 | -- | -- |
| 2023 | $1,112 | $25,130 | $5,020 | $20,110 |
| 2022 | $1,089 | $19,130 | $3,820 | $15,310 |
| 2021 | $1,123 | $17,010 | $3,400 | $13,610 |
| 2020 | $1,109 | $16,220 | $3,240 | $12,980 |
| 2019 | $1,072 | $14,330 | $2,860 | $11,470 |
| 2018 | $1,041 | $12,700 | $2,540 | $10,160 |
| 2017 | $970 | $10,430 | $2,080 | $8,350 |
| 2016 | $921 | $9,020 | $1,800 | $7,220 |
| 2015 | $855 | $7,830 | $1,560 | $6,270 |
Source: Public Records
Map
Nearby Homes
- 1837 E Pleasant Ln
- 6602 S 22nd Place
- 1632 E Saint Charles Ave
- 7032 S 19th Place
- 1701 E Carson Rd
- 5735 S 21st Place Unit 88
- 1748 E Park St
- 5749 S 21st Terrace Unit 167
- 2315 E Nancy Ln
- 1706 E Fremont Rd
- 5628 S 21st Place
- 2207 E Hidalgo Ave
- 2277 E Huntington Dr Unit 175
- 7405 S 19th St
- 2271 E Hidalgo Ave
- 2109 E Fraktur Rd Unit 52
- 2323 E Huntington Dr
- 6562 S 24th Place
- 2367 E Huntington Dr Unit 203
- 2315 E Pecan Rd
- 1931 E Saint Catherine Ave
- 6408 S 19th Place
- 1925 E Saint Catherine Ave
- 1936 E Saint Anne Ave
- 6419 S 19th Place Unit 2
- 6427 S 19th Place Unit 2
- 6402 S 19th Place
- 1928 E Saint Anne Ave
- 6413 S 19th Place
- 1926 E Saint Catherine Ave
- 1919 E Saint Catherine Ave
- 1944 E Saint Anne Ave
- 1920 E Saint Anne Ave
- 6407 S 19th Place
- 1941 E Alta Vista Rd
- 1920 E Saint Catherine Ave
- 1912 E Saint Anne Ave
- 6420 S 20th St
- 6401 S 19th Place