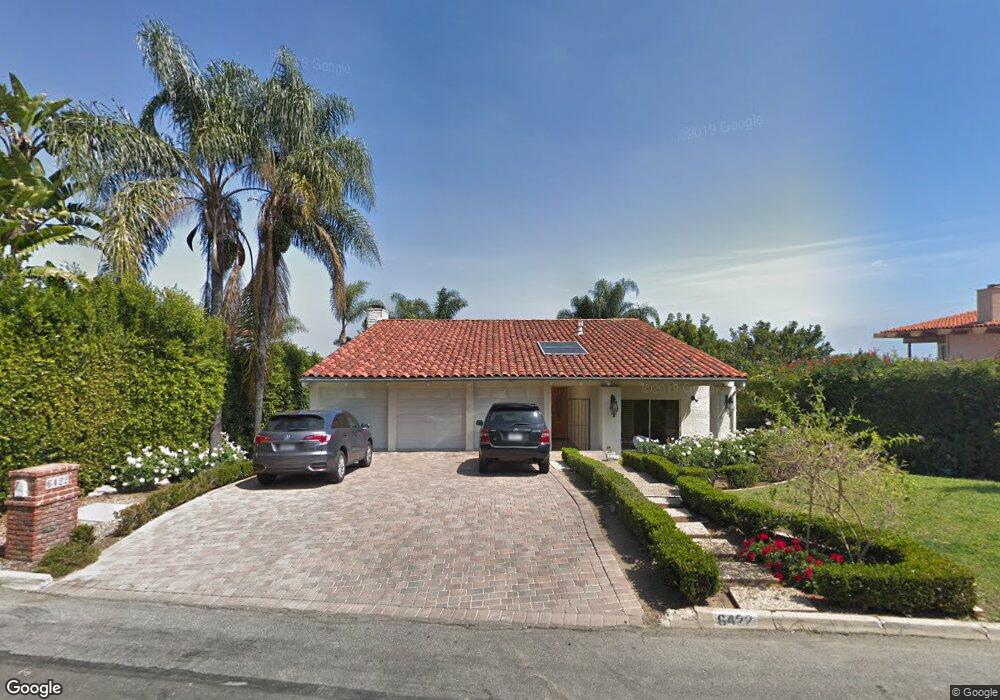
6422 Via Colinita Rancho Palos Verdes, CA 90275
Estimated Value: $1,758,205 - $2,754,000
3
Beds
3
Baths
2,640
Sq Ft
$811/Sq Ft
Est. Value
About This Home
This home is located at 6422 Via Colinita, Rancho Palos Verdes, CA 90275 and is currently estimated at $2,140,801, approximately $810 per square foot. 6422 Via Colinita is a home located in Los Angeles County with nearby schools including Mira Catalina Elementary School, Miraleste Intermediate, and Palos Verdes Peninsula High School.
Ownership History
Date
Name
Owned For
Owner Type
Purchase Details
Closed on
Dec 15, 2009
Sold by
Deluca John M and Deluca Lenore M
Bought by
Frauman Fredrick S and Frauman Rosalyn A
Current Estimated Value
Home Financials for this Owner
Home Financials are based on the most recent Mortgage that was taken out on this home.
Original Mortgage
$500,000
Outstanding Balance
$325,794
Interest Rate
4.88%
Mortgage Type
New Conventional
Estimated Equity
$1,815,007
Purchase Details
Closed on
Oct 20, 2003
Sold by
Kershaw Robert and Kershaw Barbara
Bought by
Deluca John M and Deluca Lenore M
Home Financials for this Owner
Home Financials are based on the most recent Mortgage that was taken out on this home.
Original Mortgage
$700,000
Interest Rate
5.98%
Mortgage Type
Purchase Money Mortgage
Purchase Details
Closed on
Aug 16, 1993
Sold by
Gutierrez Rudy
Bought by
Kershaw Robert and Kershaw Barbara
Create a Home Valuation Report for This Property
The Home Valuation Report is an in-depth analysis detailing your home's value as well as a comparison with similar homes in the area
Home Values in the Area
Average Home Value in this Area
Purchase History
| Date | Buyer | Sale Price | Title Company |
|---|---|---|---|
| Frauman Fredrick S | $1,050,000 | Fidelity National Title Co | |
| Deluca John M | $1,300,000 | Fntic | |
| Kershaw Robert | -- | Gateway Title Company |
Source: Public Records
Mortgage History
| Date | Status | Borrower | Loan Amount |
|---|---|---|---|
| Open | Frauman Fredrick S | $500,000 | |
| Previous Owner | Deluca John M | $700,000 |
Source: Public Records
Tax History Compared to Growth
Tax History
| Year | Tax Paid | Tax Assessment Tax Assessment Total Assessment is a certain percentage of the fair market value that is determined by local assessors to be the total taxable value of land and additions on the property. | Land | Improvement |
|---|---|---|---|---|
| 2025 | $15,761 | $1,355,352 | $850,647 | $504,705 |
| 2024 | $15,761 | $1,328,777 | $833,968 | $494,809 |
| 2023 | $15,445 | $1,302,723 | $817,616 | $485,107 |
| 2022 | $14,674 | $1,277,181 | $801,585 | $475,596 |
| 2021 | $14,616 | $1,252,139 | $785,868 | $466,271 |
| 2019 | $13,984 | $1,215,001 | $762,559 | $452,442 |
| 2018 | $13,857 | $1,191,178 | $747,607 | $443,571 |
| 2016 | $13,156 | $1,144,926 | $718,578 | $426,348 |
| 2015 | $13,108 | $1,127,729 | $707,785 | $419,944 |
| 2014 | $12,927 | $1,105,639 | $693,921 | $411,718 |
Source: Public Records
Map
Nearby Homes
- 6337 Via Colinita
- 6309 Via Colinita
- 30229 Kingsridge Dr
- 314 S Miraleste Dr Unit 116
- 322 S Miraleste Dr Unit 176
- 308 S Miraleste Dr Unit 57
- 6401 Corsini Place
- 1971 W Santa Cruz St
- 1460 W Sunrise Ln
- 1642 Saratoga Ln
- 6604 Via Siena
- 6608 Via Siena
- 4329 Via Frascati
- 2046 Chandeleur Dr
- 8 Via Subida
- 2063 Chandeleur Dr
- 378 S Miraleste Dr Unit 431
- 394 S Miraleste Dr Unit 496
- 370 S Miraleste Dr Unit 390
- 372 S Miraleste Dr Unit 398
- 6424 Via Colinita
- 6420 Via Colinita
- 6432 Via Colinita
- 6421 Via Colinita
- 6429 Via Colinita
- 6453 Via Colinita
- 6505 Via Colinita
- 6460 Via Colinita (Guest House)
- 6460 Via Colinita
- 6461 Via Colinita
- 6433 Via Colinita
- 6436 Via Colinita
- 6325 Via Colinita
- 6321 Via Colinita
- 6449 Via Colinita
- 6320 Via Colinita
- 6317 Via Colinita
- 6519 Via Colinita
- 6508 Via Colinita