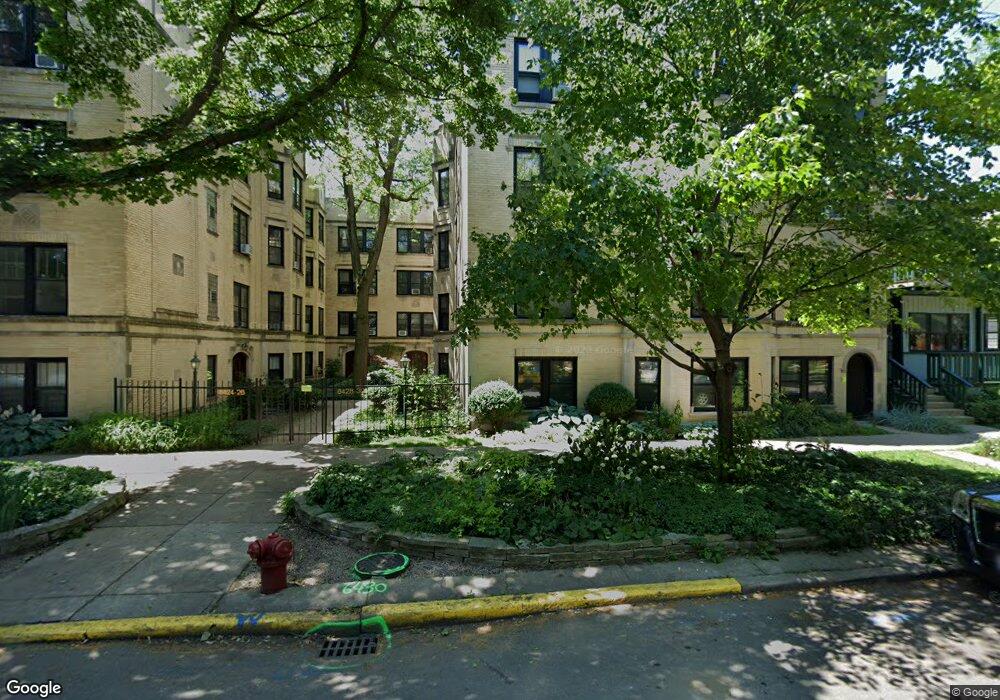
6424 N Glenwood Ave Unit 1F Chicago, IL 60626
Rogers Park NeighborhoodEstimated Value: $160,000 - $185,000
--
Bed
--
Bath
--
Sq Ft
0.32
Acres
About This Home
This home is located at 6424 N Glenwood Ave Unit 1F, Chicago, IL 60626 and is currently estimated at $170,671. 6424 N Glenwood Ave Unit 1F is a home located in Cook County with nearby schools including Kilmer Elementary School, Senn High School, and Northside Catholic Academy.
Ownership History
Date
Name
Owned For
Owner Type
Purchase Details
Closed on
May 24, 2023
Sold by
Muscia Victor J
Bought by
Robyn D Engstrom Trust
Current Estimated Value
Purchase Details
Closed on
Sep 24, 2013
Sold by
Thorpe Diana L
Bought by
Muscia Victor
Purchase Details
Closed on
Mar 28, 2002
Sold by
Borglum Sandra J
Bought by
Thorpe Diana L
Home Financials for this Owner
Home Financials are based on the most recent Mortgage that was taken out on this home.
Original Mortgage
$103,900
Interest Rate
7%
Purchase Details
Closed on
May 12, 1996
Sold by
Brackney William C and Brackney William
Bought by
Borglum Sandra Joleen
Home Financials for this Owner
Home Financials are based on the most recent Mortgage that was taken out on this home.
Original Mortgage
$44,650
Interest Rate
8.29%
Mortgage Type
FHA
Create a Home Valuation Report for This Property
The Home Valuation Report is an in-depth analysis detailing your home's value as well as a comparison with similar homes in the area
Home Values in the Area
Average Home Value in this Area
Purchase History
| Date | Buyer | Sale Price | Title Company |
|---|---|---|---|
| Robyn D Engstrom Trust | $135,000 | None Listed On Document | |
| Muscia Victor | $64,500 | Cti | |
| Thorpe Diana L | $116,000 | -- | |
| Borglum Sandra Joleen | $470,000 | Attorneys Natl Title Network |
Source: Public Records
Mortgage History
| Date | Status | Borrower | Loan Amount |
|---|---|---|---|
| Previous Owner | Thorpe Diana L | $103,900 | |
| Previous Owner | Borglum Sandra Joleen | $44,650 |
Source: Public Records
Tax History Compared to Growth
Tax History
| Year | Tax Paid | Tax Assessment Tax Assessment Total Assessment is a certain percentage of the fair market value that is determined by local assessors to be the total taxable value of land and additions on the property. | Land | Improvement |
|---|---|---|---|---|
| 2024 | $1,410 | $15,373 | $1,184 | $14,189 |
| 2023 | $1,353 | $10,000 | $956 | $9,044 |
| 2022 | $1,353 | $10,000 | $956 | $9,044 |
| 2021 | $1,341 | $9,999 | $956 | $9,043 |
| 2020 | $636 | $5,958 | $865 | $5,093 |
| 2019 | $648 | $6,654 | $865 | $5,789 |
| 2018 | $636 | $6,654 | $865 | $5,789 |
| 2017 | $478 | $5,594 | $773 | $4,821 |
| 2016 | $620 | $5,594 | $773 | $4,821 |
| 2015 | $648 | $6,161 | $773 | $5,388 |
| 2014 | $997 | $7,943 | $751 | $7,192 |
| 2013 | $1,327 | $9,927 | $751 | $9,176 |
Source: Public Records
Map
Nearby Homes
- 6421 N Greenview Ave Unit 2W
- 6447 N Glenwood Ave
- 1542 W Highland Ave
- 1457 W Rosemont Ave Unit G
- 1336 W Albion Ave Unit 2E
- 6532 N Ashland Ave
- 6328 N Magnolia Ave
- 6648 N Newgard Ave Unit 2
- 6335 N Magnolia Ave Unit G
- 1626 W Highland Ave Unit 1W
- 1243 W Rosemont Ave Unit 12433
- 6712 N Glenwood Ave Unit 2
- 6711 N Lakewood Ave Unit 2N
- 1234 W Granville Ave
- 6737 N Greenview Ave Unit 2S
- 1703 W Wallen Ave Unit 3C
- 1251 W Columbia Ave
- 6321 N Hermitage Ave
- 1265 W Granville Ave Unit 3
- 1221 W Granville Ave Unit 2B
- 6424 N Glenwood Ave Unit G1
- 6424 N Glenwood Ave Unit 3F
- 6424 N Glenwood Ave Unit 1B
- 6424 N Glenwood Ave Unit 3A
- 6424 N Glenwood Ave Unit 3C
- 6424 N Glenwood Ave Unit 3B
- 6424 N Glenwood Ave Unit 2A
- 6424 N Glenwood Ave Unit 2G
- 6424 N Glenwood Ave Unit 2C
- 6424 N Glenwood Ave Unit 1A
- 6424 N Glenwood Ave Unit 2B
- 6424 N Glenwood Ave Unit G4
- 6424 N Glenwood Ave Unit 2F
- 6424 N Glenwood Ave Unit 3D
- 6424 N Glenwood Ave Unit 2D
- 6424 N Glenwood Ave Unit G-2
- 6426 N Glenwood Ave Unit 1D
- 6426 N Glenwood Ave Unit 1C
- 6426 N Glenwood Ave Unit 3D
- 6426 N Glenwood Ave Unit 2D