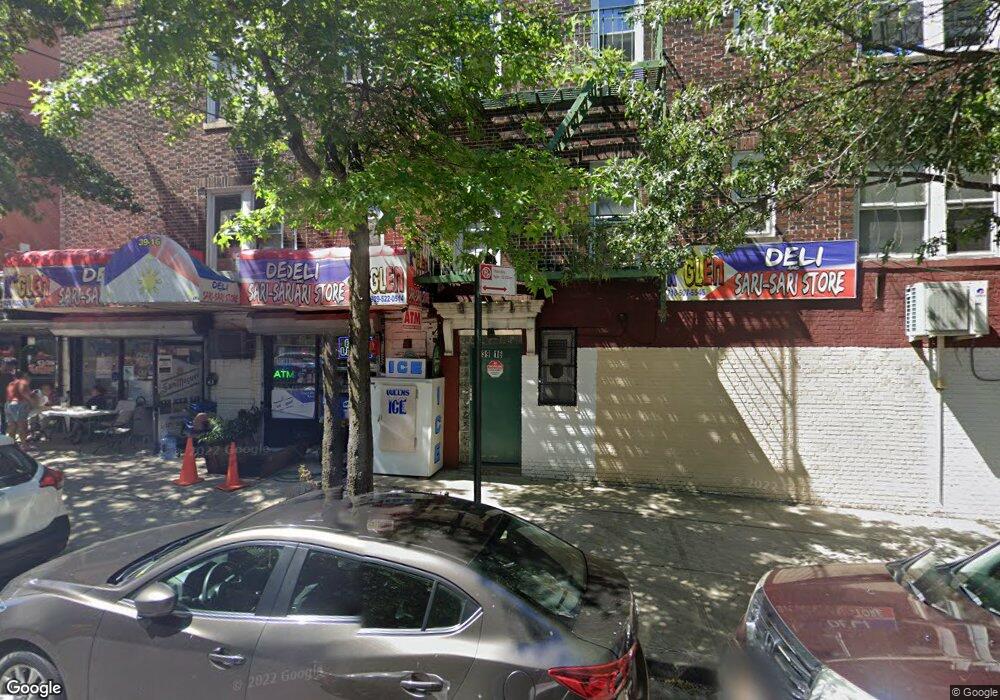
6424 Roosevelt Ave Flushing, NY 11377
Woodside NeighborhoodEstimated Value: $2,306,609
Studio
--
Bath
4,492
Sq Ft
$513/Sq Ft
Est. Value
About This Home
This home is located at 6424 Roosevelt Ave, Flushing, NY 11377 and is currently estimated at $2,306,609, approximately $513 per square foot. 6424 Roosevelt Ave is a home located in Queens County with nearby schools including P.S. 12 James B Colgate, William Cullen Bryant High School, and The Renaissance Charter School 2.
Ownership History
Date
Name
Owned For
Owner Type
Purchase Details
Closed on
May 7, 2021
Sold by
Sharma Aleyamma and Sharma Deceased
Bought by
Sharma Aleyamma and Sharma Sidharth Rishi
Current Estimated Value
Purchase Details
Closed on
Jul 29, 2016
Sold by
Hersheeba Inc
Bought by
Sharma Aleyamma and Sharma Ramesh C
Purchase Details
Closed on
Sep 14, 2006
Sold by
Ariyanonthaka Napaporn and Charalaivan Anun
Bought by
Hersheeba Inc
Home Financials for this Owner
Home Financials are based on the most recent Mortgage that was taken out on this home.
Original Mortgage
$885,000
Interest Rate
6.52%
Mortgage Type
Commercial
Purchase Details
Closed on
Nov 17, 2004
Sold by
Goodcup Deceased Johanna and Goodcup Goodcup
Bought by
Ariyanonthaka Napaporn and Charalaivan Anun
Home Financials for this Owner
Home Financials are based on the most recent Mortgage that was taken out on this home.
Original Mortgage
$665,000
Interest Rate
5.69%
Mortgage Type
Commercial
Create a Home Valuation Report for This Property
The Home Valuation Report is an in-depth analysis detailing your home's value as well as a comparison with similar homes in the area
Home Values in the Area
Average Home Value in this Area
Purchase History
| Date | Buyer | Sale Price | Title Company |
|---|---|---|---|
| Sharma Aleyamma | -- | -- | |
| Sharma Aleyamma | -- | -- | |
| Sharma Aleyamma | -- | -- | |
| Sharma Aleyamma | -- | -- | |
| Sharma Aleyamma | -- | -- | |
| Sharma Aleyamma | -- | -- | |
| Hersheeba Inc | $1,475,000 | -- | |
| Hersheeba Inc | $1,475,000 | -- | |
| Ariyanonthaka Napaporn | $1,062,000 | -- | |
| Ariyanonthaka Napaporn | $1,062,000 | -- |
Source: Public Records
Mortgage History
| Date | Status | Borrower | Loan Amount |
|---|---|---|---|
| Previous Owner | Hersheeba Inc | $885,000 | |
| Previous Owner | Ariyanonthaka Napaporn | $665,000 |
Source: Public Records
Tax History
| Year | Tax Paid | Tax Assessment Tax Assessment Total Assessment is a certain percentage of the fair market value that is determined by local assessors to be the total taxable value of land and additions on the property. | Land | Improvement |
|---|---|---|---|---|
| 2025 | $29,645 | $244,717 | $5,574 | $239,143 |
| 2024 | $29,645 | $237,124 | $6,484 | $230,640 |
| 2023 | $27,450 | $219,561 | $6,751 | $212,810 |
| 2022 | $24,874 | $296,550 | $9,450 | $287,100 |
| 2021 | $23,092 | $263,700 | $9,450 | $254,250 |
| 2020 | $23,480 | $329,850 | $9,450 | $320,400 |
| 2019 | $23,005 | $412,560 | $9,450 | $403,110 |
| 2018 | $21,481 | $168,893 | $3,095 | $165,798 |
| 2017 | $19,890 | $156,384 | $3,041 | $153,343 |
| 2016 | $18,668 | $156,384 | $3,041 | $153,343 |
| 2015 | $12,120 | $144,803 | $3,401 | $141,402 |
| 2014 | $12,120 | $140,310 | $3,955 | $136,355 |
Source: Public Records
Map
Nearby Homes
- 37-75 64th St Unit 51
- 3775 64th St Unit 31
- 37-75 64th St Unit 31
- 39-43 65th Place
- 67-05 Roosevelt Ave
- 62-16 39th Ave
- 65-22 38th Ave Unit 1A
- 65-15 38th Ave Unit 5 P
- 65-15 38th Ave Unit 5R
- 64-09 Woodside Ave Unit 2 Family Frame
- 39-82 65th Place Unit 4F
- 41-36 66th St Unit 2B
- 40-36 69th St
- 6109 39th Ave Unit M5
- 61-09 39th Ave Unit M 2
- 62-10 Woodside Ave Unit 311
- 3714 68th St
- 6105 39th Ave Unit G3
- 6105 39th Ave Unit D6
- 37-59 61st St Unit 5A
- 6422 Roosevelt Ave
- 6420 Roosevelt Ave
- 64-20 Roosevelt Ave
- 6418 Roosevelt Ave
- 6416 Roosevelt Ave
- 3920 65th St
- 39-20-39-65 65th St
- 6414 Roosevelt Ave
- 39-15 65th St Unit 1R
- 3924 65th St
- 39-07 65th Place
- 6419 Roosevelt Ave
- 6411 Roosevelt Ave
- 6413 Roosevelt Ave
- 6402 Roosevelt Ave
- 65-12 Roosevelt Ave
- 6409 Roosevelt Ave
- 6502 Roosevelt Ave
- 65-16 Roosevelt Ave
- 3928 65th St
Your Personal Tour Guide
Ask me questions while you tour the home.