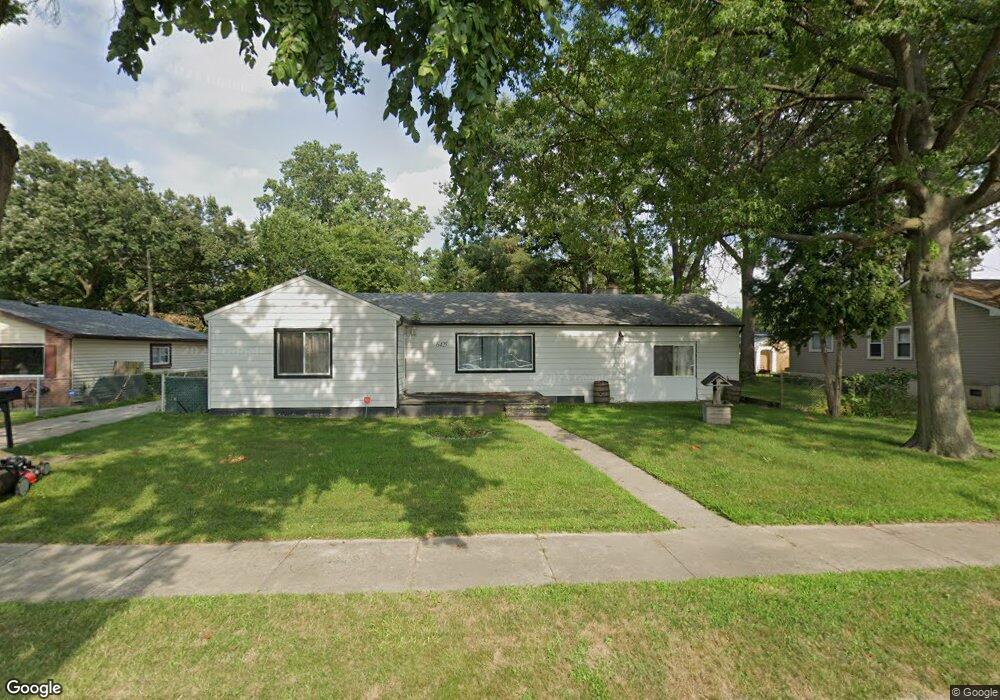
6425 Pine St Taylor, MI 48180
Estimated Value: $182,000 - $207,000
Studio
--
Bath
1,522
Sq Ft
$130/Sq Ft
Est. Value
About This Home
This home is located at 6425 Pine St, Taylor, MI 48180 and is currently estimated at $198,143, approximately $130 per square foot. 6425 Pine St is a home located in Wayne County with nearby schools including Clarence Randall Elementary School, Hoover Middle School, and Quest Charter Academy.
Ownership History
Date
Name
Owned For
Owner Type
Purchase Details
Closed on
Oct 15, 2012
Sold by
Wayne County Treasurer
Bought by
Perez Jessica A
Current Estimated Value
Purchase Details
Closed on
Oct 17, 2006
Sold by
Cody Elizabeth A and Michels Elizabeth A
Bought by
Vance Blain
Purchase Details
Closed on
Apr 2, 2000
Sold by
Janice M Vanslambrouck
Bought by
Elizabeth A Michels
Purchase Details
Closed on
Mar 20, 1998
Sold by
Garrasi Vincent
Bought by
Vanslambrouck Janice M
Create a Home Valuation Report for This Property
The Home Valuation Report is an in-depth analysis detailing your home's value as well as a comparison with similar homes in the area
Home Values in the Area
Average Home Value in this Area
Purchase History
| Date | Buyer | Sale Price | Title Company |
|---|---|---|---|
| Perez Jessica A | $12,300 | None Available | |
| Vance Blain | $109,000 | Downriver Title Agency | |
| Elizabeth A Michels | $105,000 | -- | |
| Vanslambrouck Janice M | $78,500 | -- |
Source: Public Records
Tax History
| Year | Tax Paid | Tax Assessment Tax Assessment Total Assessment is a certain percentage of the fair market value that is determined by local assessors to be the total taxable value of land and additions on the property. | Land | Improvement |
|---|---|---|---|---|
| 2025 | $2,086 | $106,000 | $0 | $0 |
| 2024 | $2,020 | $93,400 | $0 | $0 |
| 2023 | $2,429 | $82,800 | $0 | $0 |
| 2022 | $1,928 | $74,600 | $0 | $0 |
| 2021 | $2,134 | $67,500 | $0 | $0 |
| 2020 | $2,113 | $59,900 | $0 | $0 |
| 2019 | $211,173 | $48,100 | $0 | $0 |
| 2018 | $1,655 | $38,900 | $0 | $0 |
| 2017 | $928 | $38,900 | $0 | $0 |
| 2016 | $2,747 | $37,800 | $0 | $0 |
| 2015 | $3,740 | $37,400 | $0 | $0 |
| 2013 | $3,740 | $38,700 | $0 | $0 |
| 2012 | $1,633 | $38,200 | $14,700 | $23,500 |
Source: Public Records
Map
Nearby Homes
- 6456 Birch St
- 6587 Elm St
- 6606 Cornell St
- 6753 Madison St
- 6864 Cornell St
- 6784 Cooper St
- 6550 Buck St
- 6042 Banner St
- 5871 Cooper St
- 5952 Banner St
- 5689 Cornell St
- 6420 Burr St
- 7166 Pardee Rd
- 5871 Banner St
- 5843 Banner St
- 6605 Bailey St
- 5578 Grindley Park St
- 5880 Burr St
- 22823 N Brookside Dr
- 000 Hanover St
Your Personal Tour Guide
Ask me questions while you tour the home.