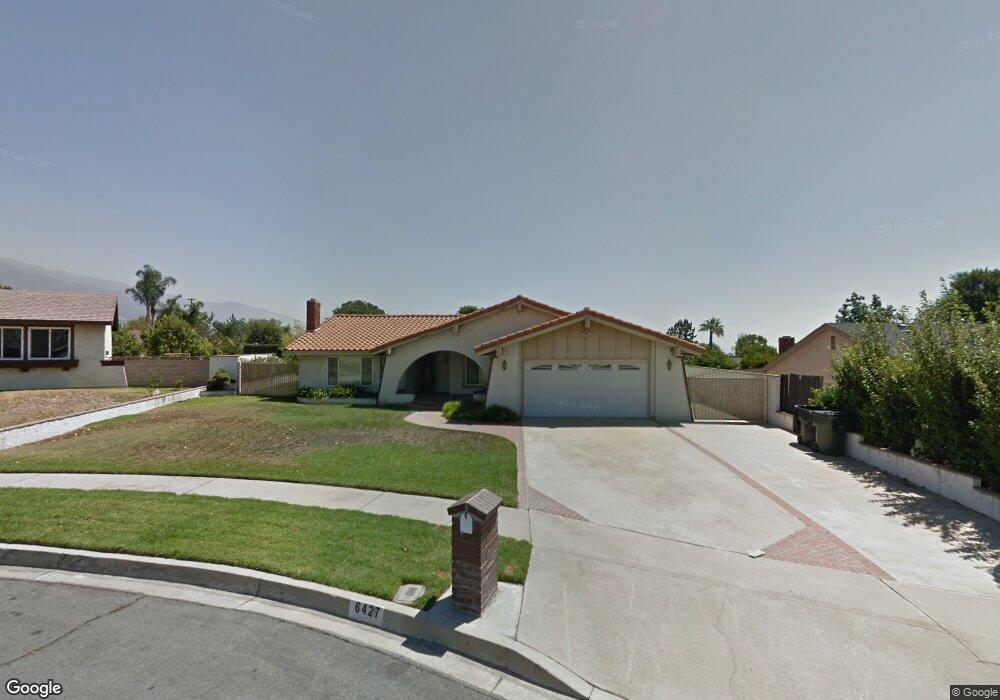
6427 Emerald St Rancho Cucamonga, CA 91701
Alta Loma NeighborhoodEstimated Value: $779,000 - $887,000
4
Beds
2
Baths
1,957
Sq Ft
$417/Sq Ft
Est. Value
About This Home
This home is located at 6427 Emerald St, Rancho Cucamonga, CA 91701 and is currently estimated at $815,708, approximately $416 per square foot. 6427 Emerald St is a home located in San Bernardino County with nearby schools including Carnelian Elementary, Alta Loma Junior High, and Alta Loma High School.
Ownership History
Date
Name
Owned For
Owner Type
Purchase Details
Closed on
Apr 2, 2009
Sold by
Patella Rosalie
Bought by
Patella Frank
Current Estimated Value
Home Financials for this Owner
Home Financials are based on the most recent Mortgage that was taken out on this home.
Original Mortgage
$130,000
Outstanding Balance
$81,517
Interest Rate
4.79%
Mortgage Type
New Conventional
Estimated Equity
$734,191
Purchase Details
Closed on
Nov 15, 1994
Sold by
Federal Home Loan Mortgage Corporation
Bought by
Patella Frank and Patella Rosalie
Home Financials for this Owner
Home Financials are based on the most recent Mortgage that was taken out on this home.
Original Mortgage
$124,800
Interest Rate
3.75%
Purchase Details
Closed on
Sep 6, 1994
Sold by
Mcalpine William and Mcalpine Penny
Bought by
Federal Home Loan Mortgage Corporation
Create a Home Valuation Report for This Property
The Home Valuation Report is an in-depth analysis detailing your home's value as well as a comparison with similar homes in the area
Home Values in the Area
Average Home Value in this Area
Purchase History
| Date | Buyer | Sale Price | Title Company |
|---|---|---|---|
| Patella Frank | -- | California Counties Title Co | |
| Patella Frank | $156,000 | Orange Coast Title Co | |
| Federal Home Loan Mortgage Corporation | $145,000 | First Southwestern Title Co |
Source: Public Records
Mortgage History
| Date | Status | Borrower | Loan Amount |
|---|---|---|---|
| Open | Patella Frank | $130,000 | |
| Closed | Patella Frank | $124,800 |
Source: Public Records
Tax History
| Year | Tax Paid | Tax Assessment Tax Assessment Total Assessment is a certain percentage of the fair market value that is determined by local assessors to be the total taxable value of land and additions on the property. | Land | Improvement |
|---|---|---|---|---|
| 2025 | $2,860 | $262,032 | $100,783 | $161,249 |
| 2024 | $2,788 | $256,894 | $98,807 | $158,087 |
| 2023 | $2,724 | $251,857 | $96,870 | $154,987 |
| 2022 | $2,715 | $246,919 | $94,971 | $151,948 |
| 2021 | $2,713 | $242,078 | $93,109 | $148,969 |
| 2020 | $2,601 | $239,596 | $92,154 | $147,442 |
| 2019 | $2,629 | $234,898 | $90,347 | $144,551 |
| 2018 | $2,569 | $230,292 | $88,575 | $141,717 |
| 2017 | $2,451 | $225,776 | $86,838 | $138,938 |
| 2016 | $2,384 | $221,349 | $85,135 | $136,214 |
| 2015 | $2,368 | $218,024 | $83,856 | $134,168 |
| 2014 | $2,300 | $213,753 | $82,213 | $131,540 |
Source: Public Records
Map
Nearby Homes
- 8635 Orange St
- 8919 Alta Loma Dr
- 6389 Jasper St
- 6361 Sard St
- 8990 19th St Unit 314
- 6285 Beryl St
- 6815 Coral Ct
- 9160 Garden St
- 8607 Buggy Whip Rd
- 6639 Eastwood Ave
- 9111 Hamilton St
- 9221 Banyan St
- 5848 Burlwood Ct
- 1661 Danbrook Place
- 6901 Saddleback Place
- 5836 Buckthorn Ave
- 8841 Monte Vista St
- 6953 Saddleback Place
- 8715 Lurline St
- 8510 Monte Vista St
- 6437 Emerald St
- 6421 Emerald St
- 6428 Sunstone Ave
- 6420 Sunstone Ave
- 6444 Sunstone Ave
- 6447 Emerald St
- 8724 Somerset Dr
- 6432 Emerald St
- 6454 Sunstone Ave
- 6416 Sunstone Ave
- 6450 Emerald St
- 8751 Orange St
- 8737 Orange St
- 8714 Somerset Dr
- 8742 Alta Loma Dr
- 8767 Orange St
- 8758 Alta Loma Dr
- 6460 Emerald St
- 8727 Orange St
- 8770 Alta Loma Dr
Your Personal Tour Guide
Ask me questions while you tour the home.